
Equities
Chart 1: Fund managers still holding above average exposure to stocks
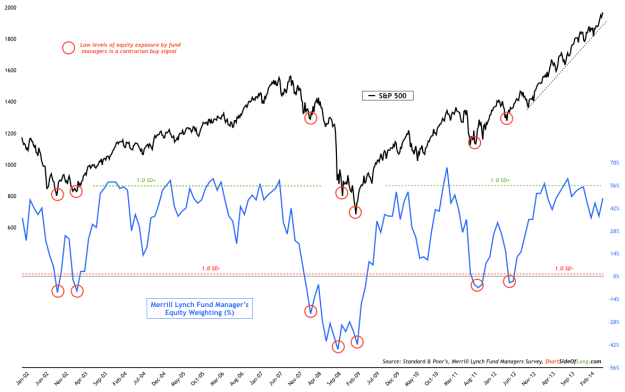
- This months Merrill Lynch Fund Manager Survey equity exposure came in at 48% overweight, relative to last months reading of 37%. Managers remain quite bullish as stock exposure is still only modestly lower then the 60% overweight we saw in September 2013 (2nd highest reading since surveys inception). Also to note, fund managers have been extremely overweight global equities without a mean reversion back below 28% for longer than any other period in survey’s history. In other words, managers remain persistently bullish for almost two years now. As a side note, this closely links to the fact that the S&P 500 has traded above the 200 MA for almost 85 weeks now (same time frame).
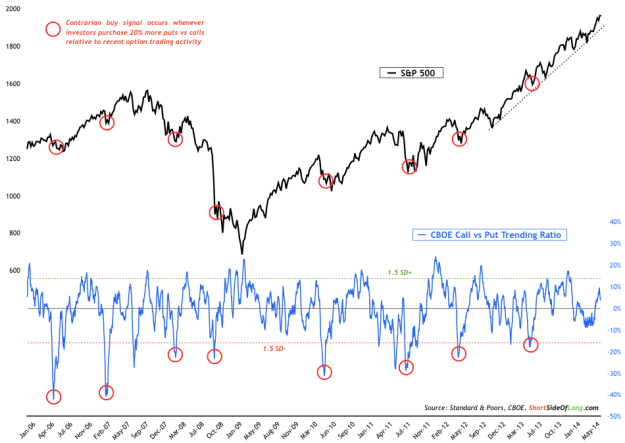
Chart 2: Complacency remains major worry with lack of bearish traders!
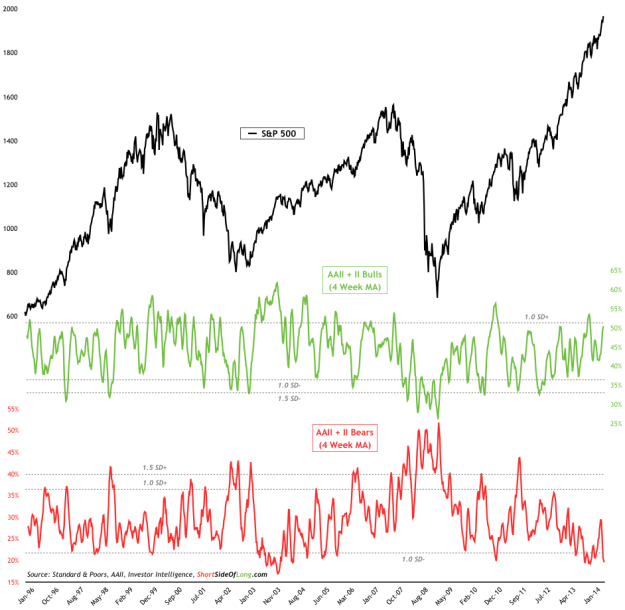
- Summarising various the equity sentiment survey readings for the month, we can observe in the chart above that bullish sentiment is once again approaching extremes. However, by far the most important story is the lack of bearish investors, non-existent volatility and very low volumes. With 4 week readings lower than 1 standard deviation below the mean, both AAII and II surveys are signalling that investors are very complacent, to say the least. Other sentiment surveys confirm these conditions including NAAIM surveys net long equity 4 week exposure at 88% and Consensus Bullish % survey showing 71% bulls this week (all in the high side).
Chart 3: Positive streak in global equity fund flows has taken a breather
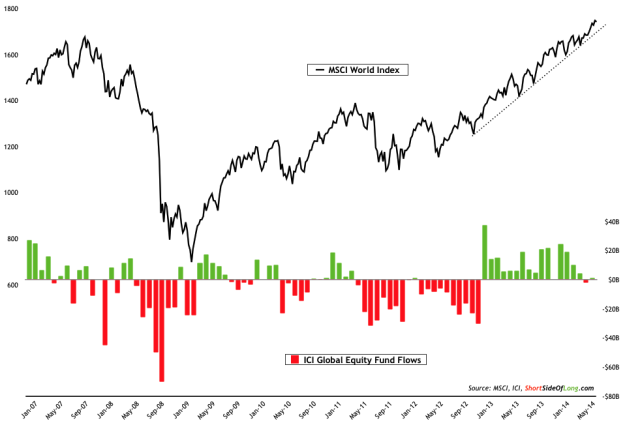
- This month’s fund flows report by ICI showed global equity funds had estimated inflows of $1.39 billion in the month of June. This compares to a total estimated outflows of -$2.2 billion in the month of May. After 16 consecutive monthly inflows, global equity funds have seen the positive streak broken in May with a slight outflow. However, with the market continuing its rally, you can bet your bottom dollar that fund managers around the world are chasing the momentum ever so higher. Therefore, further inflows in coming weeks are to be expected. The main question still remains: how wise is it to be piling into a five year aged bull market?
Chart 4: Margin debt has peaked, but the stock market rally continues…
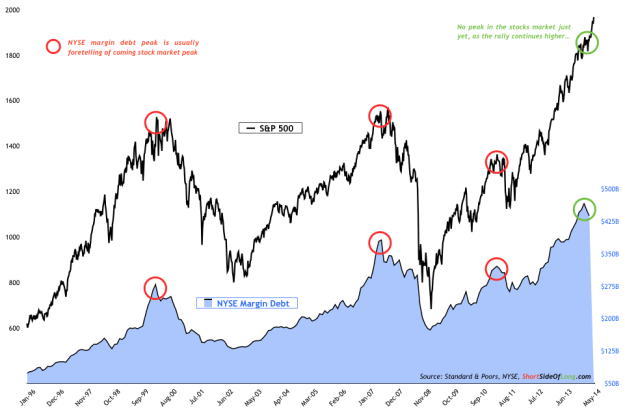
- According to NYSE’s latest monthly report, investor margin debt decreased by $13.1 billion to $437.2 billion. Month of May was the second consecutive monthly decline in investor leverage, after the intermediate peak in February of this year at a record $465.7 billion of debt. The extremes in the nominal raw data seen above is also confirmed by margin debt readings adjusted for inflation, as well as relative to the US GDP. Nevertheless, the stock market has decided to in ignore yet another warning flag, as it moves ever so higher towards new records.
- Summarising this month’s options and volatility conditions can be done with one word: complacency. Volatility on many asset classes, and not just US stocks, remains very low; volumes are anaemic and have been for awhile; while traders continue to favour purchases of calls relative to puts in most cases (especially equity p.c. ratio not shown here). Various corporate bond spreads, credit default swap indices and interbank swap rates are all at historically low levels. It seems that the consensus isn’t worried about much, but interestingly enough certain options traders are once again bidding up the Skew Index (chart below). What are they worried about and what could possibly go wrong?
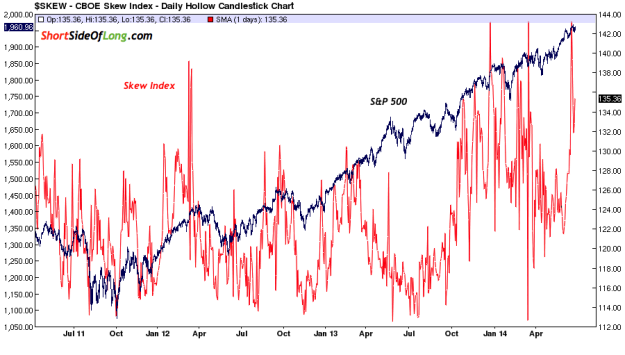
Chart 7: Equities as a percentage of financial assets is above ’07 highs!
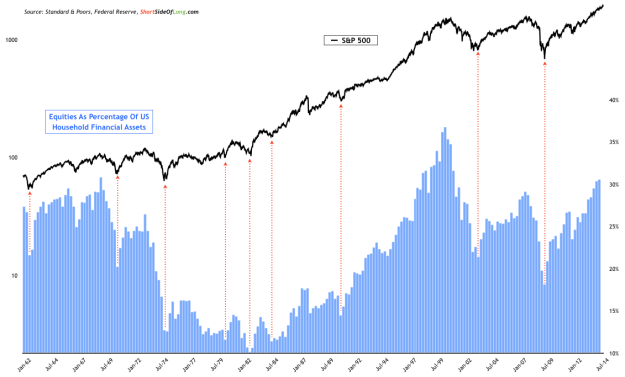
- Quarterly report by Federal Reserve on US household balance sheets shows a slight, but continual increase in equity exposure relative to total financial assets. On average, US households today hold 30.6% of their financial assets in stocks compared to last quarters reading of 30.4%. Having said that, the exposure has increased by a whopping 12.4 percentage points in a five year period from March 2009 quarter until March 2014 quarter. What’s even more interesting, is that current exposure has only been bettered once in Jan-Mar 1969 and 11 quarters between early 1998 and late 2000. Both of these periods marked the beginning of a long sideways under-performance by US stocks.
Cash & Bonds
Chart 8 & 9: Hedge fund cash levels are high, while retail investors low…
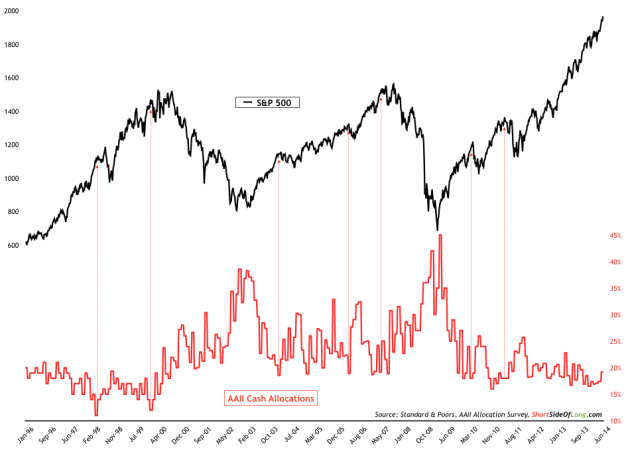
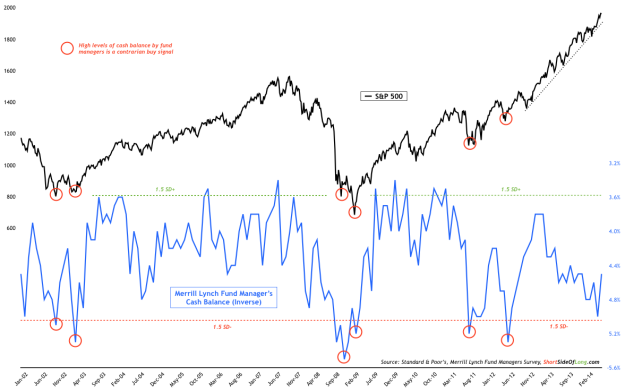
- Recently monthly AAII Asset Allocation Survey cash exposure remained low at 19.2%, compared two last months readings of 17.4% and 17.1%. Since the stock rally started in October 2011, retail investors have been holding an extremely low levels of cash. This usually occurs near intermediate market peaks, however the current rally seems unstoppable right now (refer to the chart above). Contrasting retail investors, fund managers are currently overweight cash. This months Merrill Lynch Fund Manager Survey cash exposure came in at 4.5%, relative to last months reading of 5.0%. As we can see in Chart 9, last months reading was close to 1.5 standard deviations away from a decade long mean, which is usually associated with long term buying opportunities.
Chart 10: Fund managers remain underweight bonds despite strong rally
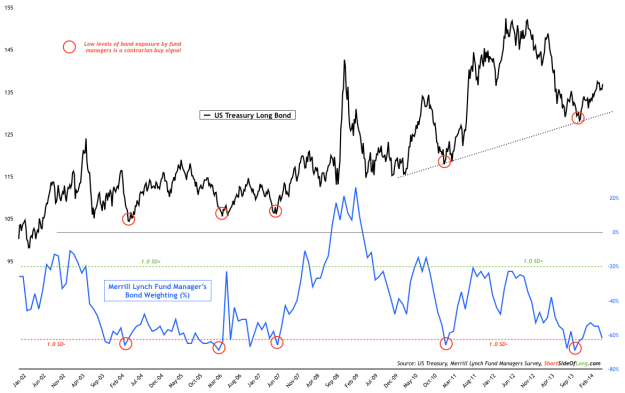
- This months Merrill Lynch Fund Manager Survey bond exposure came in at 62% underweight, relative to last months reading of 55% underweight. Despite a powerful six months rally in bonds, where long duration Treasuries outperformed the S&P 500, managers remain extremely bearish on the asset class. Why is this? It seems that fund managers are positioned this way because they are not paying attention to the market price, and instead are anticipating a rate hike from global central banks like Federal Reserve, Bank of England, Bank of Canada and Reserve Bank of Australia.
Chart 11: Strong 1st half rally in bonds has improved sentiment surveys
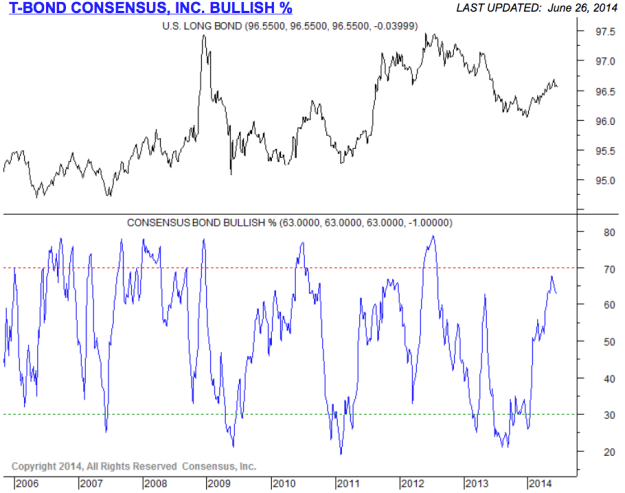
- Summarising various bond sentiment surveys for the month, we can observe in the chart above that Bullish Consensus has recovered meaningfully from the depressed sentiment of 2013. While readings are approaching extremes, I’d argue that the cautionary sell signal won’t be triggered until we see at least 75% bulls, relative to the current reading of 63%. Other sentiment surveys do confirm the mean reversion in sentiment from negativity seen in 2013, but are not as bullish as the chart above.
Chart 12: Bond funds are recording a sixth consecutive monthly inflow!
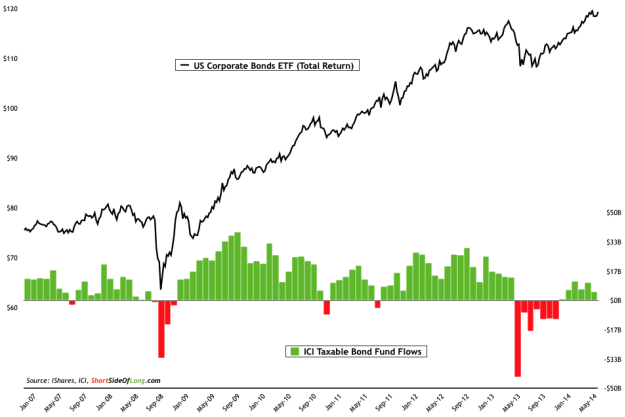
- This month’s fund flows report by ICI showed taxable bond funds had estimated inflows of $4.83 billion in the month of June. This compares to a total estimated inflows of $10.2 billion in the month of May. Last years panic, coupled together with huge retail investor outflows, marked a bottom in corporate bond space. On total return basis, corporate bond ETF is now making new highs as we post a sixth consecutive monthly inflow. If you paid attention to the blog throughout Q4 of 2013, I was constantly drawing similarities between outflows we saw in ’08 relative to outflows we saw last year. From a contrarian of view, both ended up marking important lows.
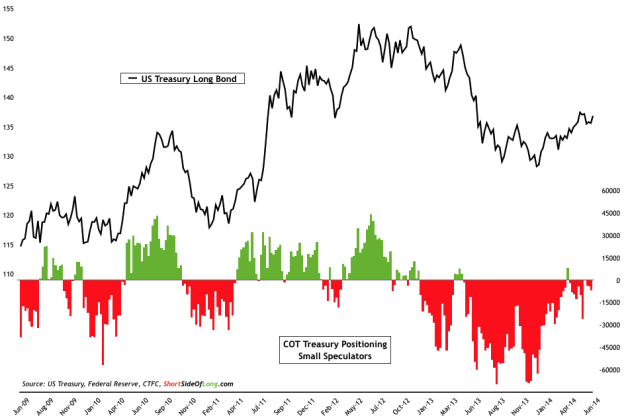
Chart 13: Speculators have covered their shorts, but aren’t bullish bonds
-
This month’s commitment of traders reports shows that small speculators have covered just about all net short positions on the Treasury Bonds. Bears were pressing hard against bonds in August 2013 with -69,809 net short contracts, and again in December 2013 with -68,633 net short contracts. From a contrary standpoint, both of these dates marked what looks to be like a short term technical double bottom in the Treasury market. It is also worth stating that despite the fact speculators have covered shorts, we do not yet see any bullishness with net long bets.
Commodities
Chart 14: Global fund managers continue to underweight commodities!
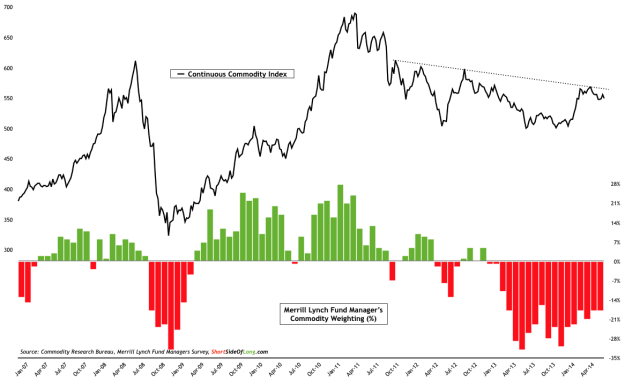
- This months Merrill Lynch Fund Manager Survey commodity exposure came in at 18% underweight, unchanged from last months reading. Despite a slight improvement in positioning, as seen in the chart above, managers still continue to dislike commodities and have persistently done so since late 2012. Technically speaking, Continuous Commodity Index looks to be in a sideways consolidation zone, but I find it very interesting that commodities on equal weighted basis still trade at levels around 2008 peak (which is very high relative to a decade ago) and yet sentiment is extremely negative.
Chart 15: Hedge funds have started cutting their net long positioning…
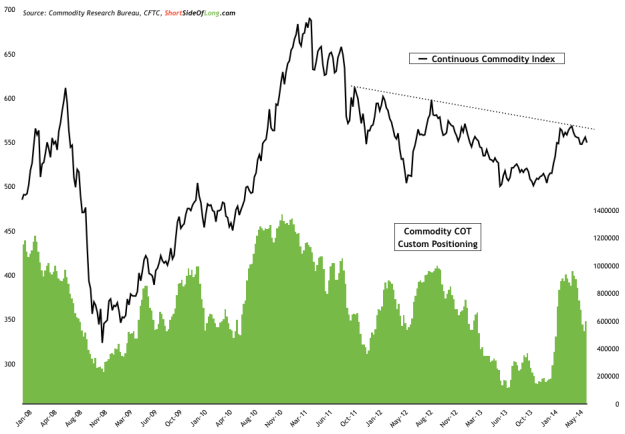
- This month’s commitment of traders reports showed that hedge funds and other speculators have started slashing net long contracts. Custom COT total right now stands at 599,344 net long contracts, compared to last months reading of 746,507 net long contracts. During the current rally from December 2013 lows, net long buying peaked in the first week of May as contracts approached a one million level (956,667). While hedge funds aren’t completely shaken out just yet, looking at it from another perspective, net long positioning has decreased by over 330,000 contracts over a three month rolling period and yet the price has barley sold off. Is this a positive sign of the continuation of the current commodity rally?
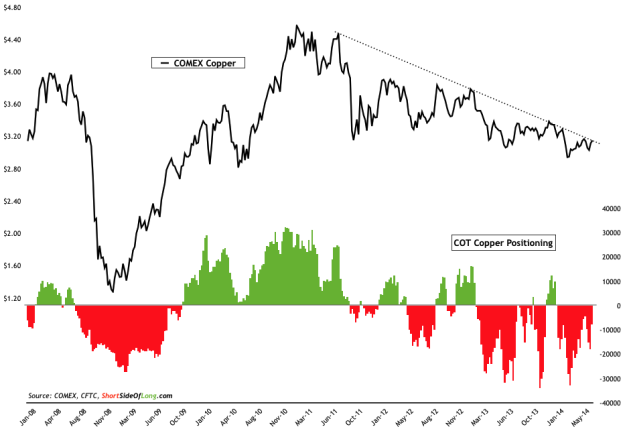
Chart 16: Industrial metals like Copper are yet to participate in the rally
-
We have been focusing on the base metals quite a lot in recent blog posts. Even during the first Q1 of 2014, I have been anticipating a possible outperformance in a disliked industrial metals space. So far, majority of the sector has been relatively flat (apart from Nickel and Palladium). However, the poster boy of base metal sector, Copper (together with Aluminium not shown here), could now be joining the rally. If we observe the chart above, we could make an assumption that Copper has a decent chance of breaking out from its downtrend, despite all of the negativity coming out of China. Recent large short bets could be in for a squeeze, so watch this metal in coming weeks and months.
Currencies & PMs
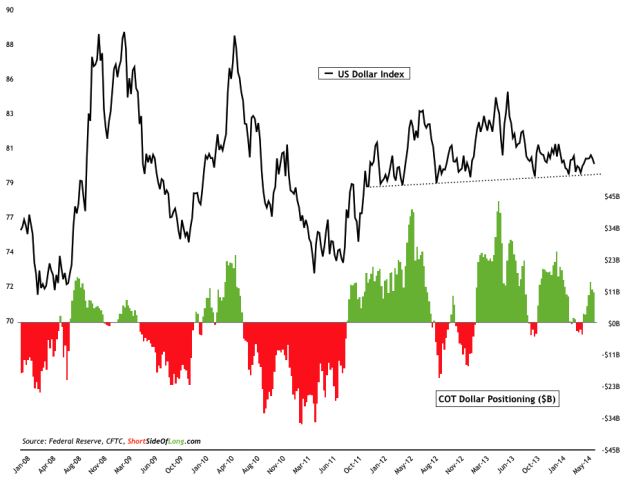
Chart 17: Funds remain slightly bullish USD despite continual Fed taper
-
This month’s commitment of traders reports have shown modest increase in US Dollar net long positioning, despite a slight trim over the last week or two. This months custom COT total stands at $10.85 billion of net long contracts, compared to last months level of $5.95 billion of net long contracts. In summary, positioning is slightly bullish but generally speaking, neutral at present. Technically speaking, the support line seen in the chart above has prevented greenback’s decline, with prices consolidating over two years now. Traders should pay attention to the index in coming weeks and months, as the range is getting ever so narrower.
Chart 18: Canadian Dollar bears squeezed as currency stages recovery!
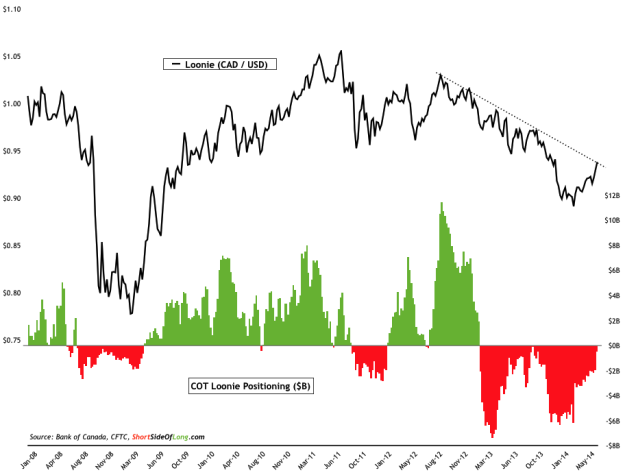
- Middle of 2011 marked an important peak when it came to the so called “inflation trade” as we can see in the charts of commodities, emerging markets or currencies like the Aussieor the Loonie in Chart 18. The Northern American currency has now been in a downtrend for more then three years, but has the situation and the trend recently changed? The mini-panic sell off into early 2014 shook out a lot of bulls and now the net short COT positions are scrambling for cover. Hedge funds and other speculators are close to turning net long for the first time since late 2012 just as the currency finds resistance. Could the Loonie be possibly discounting a potential rate hike by the BoC in coming months?
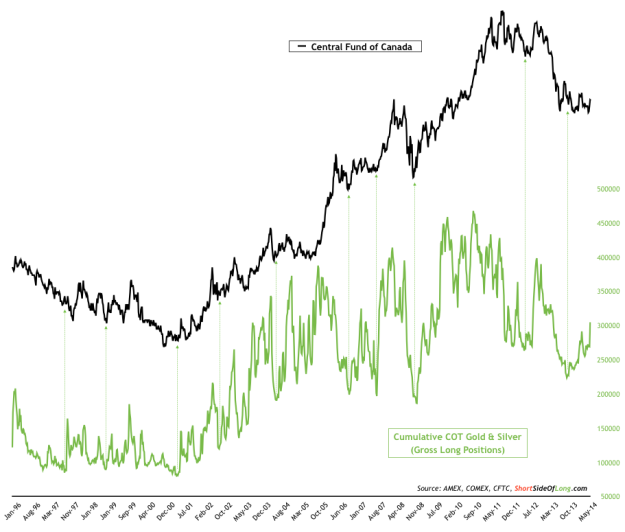
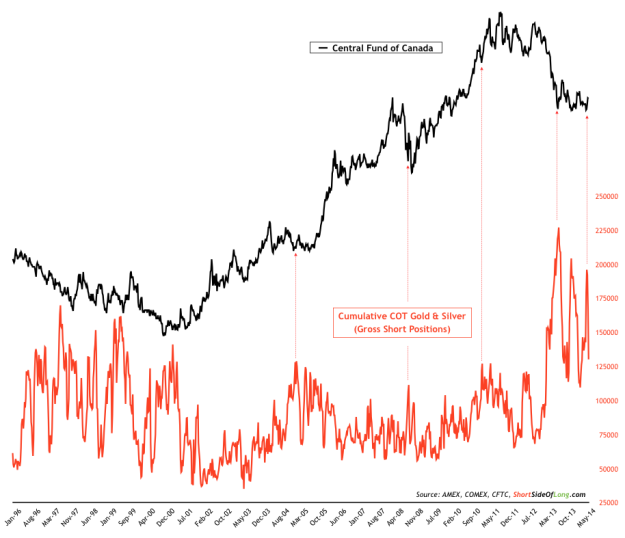
Chart 19 & 20: Hedge funds have been covering their short bets on PMs!
-
This month’s commitment of traders reports have shown substantial increase in Precious Metals net long positioning. Gold COT stands 131,607 net long contracts (33.5% of OI) in the month of June, compared to last months level of 78,638 (19.8% of OI). In the Silver market, COT stands 42,897 net long contracts (27.1% of OI), compared to last months level of 14,230 (9.1% of OI). The two charts above show cumulative gross longs and shorts in Gold and Silver market. We should be able to observe that while majority of the recent changes in the COT have come from short covering (especially in Silver), there has also been some buying interest as well. Technically speaking, PMs sector still remains in a downtrend and has to overcome quite a few resistance levels before a bull market is to return.