
Jones Lang LaSalle Inc. (NYSE:JLL) — popularly known as JLL — reported fourth-quarter 2018 adjusted earnings of $5.99 per share, surpassing the Zacks Consensus Estimate of $4.74. The bottom line compares favorably with the year-ago adjusted earnings of $4.53 per share.
Revenues for the reported quarter came in at around $4.89 billion, outpacing the Zacks Consensus Estimate of $4.71 billion. The reported figure improved 12.6%, year over year. Fee revenues were up 13.5% year over year to $2.1 billion.
Results highlight robust double-digit organic Real Estate Services revenue growth, aided by Leasing and Corporate Solutions segments. Further, the Americas’ segment performance, LaSalle incentive fees and EMEA improvement helped expand margin. In addition, assets under management reached a record $60.5 billion, driven by LaSalle private equity capital raise. Reflecting robust sentiments, the shares have soared up more than 8% in today’s initial trading session.
For full-year 2018, JLL reported adjusted earnings per share of $12.25, up 31.6% from $9.31 in the prior year. This was backed by 12.9% year-over-year growth in $16.3 billion.
Behind the Headline Numbers
During the quarter under review, JLL’s Real Estate Services revenues climbed 11% year over year to $4.7 billion. In the Americas, revenues and fee revenues came in at $2.7 billion and $1.0 billion, respectively, indicating 16% and 22% year-over-year growth.
This was backed by growth in the leasing, reflecting momentum in the New York, Midwest and Northwest U.S. markets. Also, the Property & Facility Management segment reported growth as a result of ramp-up of recent wins, along with expansion of present facilities management relationships with Corporate Solutions clients.
Revenues and fee revenues of the EMEA segment came in at $1.06 billion and $574.1 million, up 6% and 2%, respectively, from the year-ago period. Results reflect growth in Property & Facility Management segment as a result of the stabilization of Integral.
For the Asia-Pacific segment, revenues and fee revenues came in at $934.3 million and $351.7 million, respectively, marking year-over-year jump of 5% and a decline of 2%, respectively. Results highlight improved revenues from Property & Facility Management due to new business and expansion of client mandates, as well as growing leasing revenues, mainly from office and industrial sectors in Greater China and Australia.
Revenues from the LaSalle Investment Management segment recorded rise of 63% year over year to $150.3 million. Strong incentive fees due to real estate dispositions on behalf of clients, mainly in the Asia Pacific, attributed to this increase.
At the end of 2018, assets under management were $60.5 billion, up 2% from $59.5 billion recorded at the end of the last reported quarter.
Liquidity
Jones Lang exited the reported quarter with cash and cash equivalents of $480.9 million, up from $268 million as of Dec 31, 2017. Moreover, reflecting continued strong cash generation by the company, the company’s net debt totaled $289.3 million at the end of 2018, denoting decline of $453.5 million and $296.9 million from Sep 30, 2018 and Dec 31, 2017, respectively.
Our Viewpoint
JLL’s fourth-quarter performance is encouraging. The company has a diversified product & services range which helps register balanced revenue growth across its operating markets. Moreover, spate of strategic investment activities, in a bid to capitalize on market consolidations, are anticipated to boost long-term profitability. In fact, going forward, market-share expansion will help JLL achieve stellar growth and a decent cash level.
Nevertheless, after years of decent growth, commercial real estate transaction volumes have been declining. This could affect the company’s revenues from property sales business. Also, rising interest rates may affect the company’s capital markets’ activity. Furthermore, trade tensions, political uncertainty and volatile equity markets are anticipated to add to the woes, affecting transaction levels.
JLL currently has a Zacks Rank #3 (Hold). You can see the complete list of today’s Zacks #1 Rank (Strong Buy) stocks here.
Jones Lang LaSalle Inc. Price, Consensus and EPS Surprise
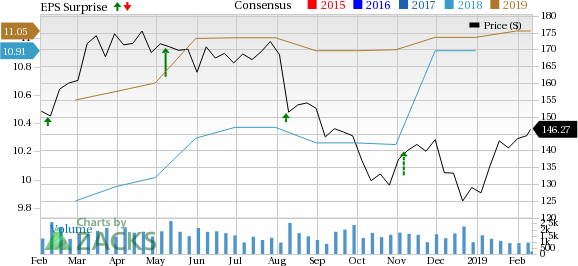
Jones Lang LaSalle Incorporated Price, Consensus and EPS Surprise | Jones Lang LaSalle Incorporated Quote
We now look forward to the earnings releases of CBRE Group Inc. (NYSE:CBRE) , Colliers International Group Inc. (TO:CIGI) and HFF Inc. (NYSE:HF) . While CBRE and Colliers International are scheduled to report quarterly numbers on Feb 13, HFF is slated to release earnings on Feb 21.
Zacks' Best Stock-Picking Strategy
It's hard to believe, even for us at Zacks. But from 2000-2018, while the market gained +4.8% per year, our top stock-picking strategy averaged +54.3% per year.
How has that screen done lately? From 2017-2018, it sextupled the market's +15.8% gain with a soaring +98.3% return.
Free – See the Stocks It Turned Up for Today >>
Jones Lang LaSalle Incorporated (JLL): Free Stock Analysis Report
HFF, Inc. (HF): Free Stock Analysis Report
Colliers International Group Inc. (CIGI): Free Stock Analysis Report
CBRE Group, Inc. (CBRE): Free Stock Analysis Report
Original post
Zacks Investment Research