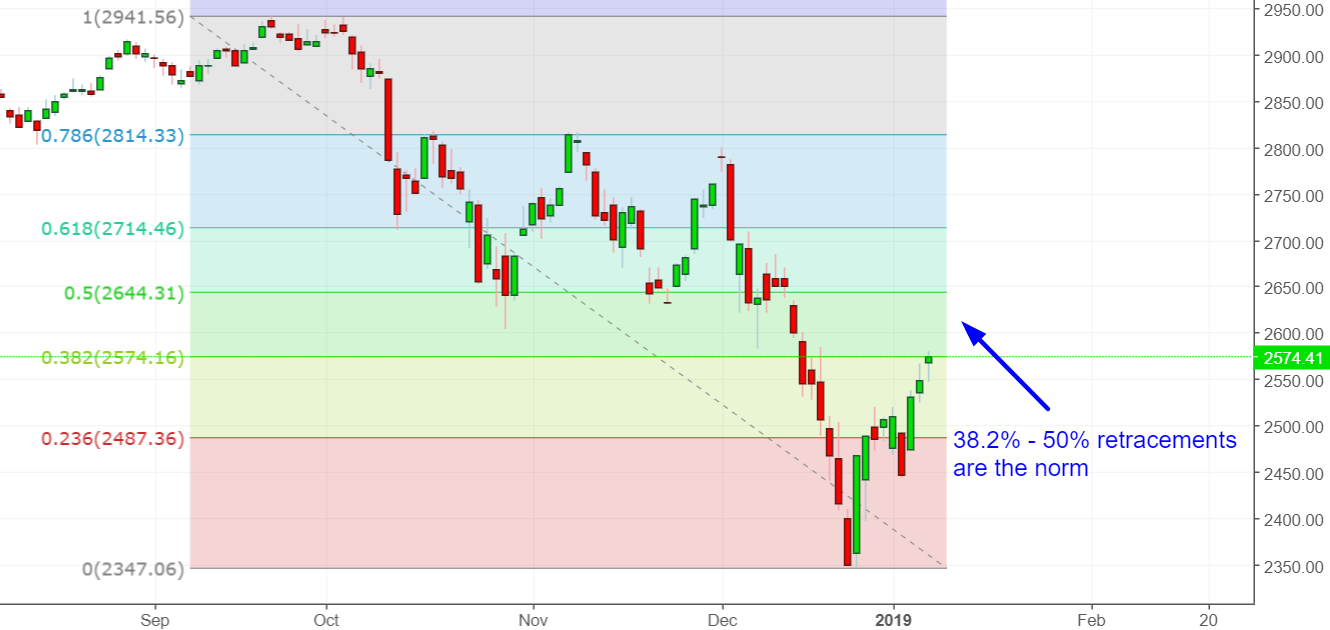
After a sharp drop and an equally sharp rally, the S&P 500 has finally reached our 38.2% minimum retracement rally.
We repeat: while a V-shaped recovery is possible, that is not the most likely scenario. The most likely scenario is for the stock market to retest its lows once it gets close to its 50% retracement line.
Go here to understand our fundamentals-driven long term outlook.
Let’s determine the stock market’s most probable medium term direction by objectively quantifying technical analysis. For reference, here’s the random probability of the U.S. stock market going up on any given day.

*Probability ≠ certainty. Past performance ≠ future performance. But if you don’t use the past as a guide, you are blindly “guessing” the future.
Terrific Start To January
After a terrible December, the S&P 500 is off to a great start in January. Many traders take seasonality into considering, and one of these seasonality factors is the “January barometer”. There are a couple of sayings:
- As January goes, so goes the rest of the year.
- What the stock market does in the first 5 days of each year impacts what it will do the rest of the year.
We consider seasonality factors to be of tertiary importance since most seasonality factors don’t make much logical sense. In a vast enough universe, there will always be patterns that exist for no reason other than randomness.
Here’s what happened next to the S&P 500 after it went up more than 2% in the first 5 trading days of each year.
*Data from 1923 – present
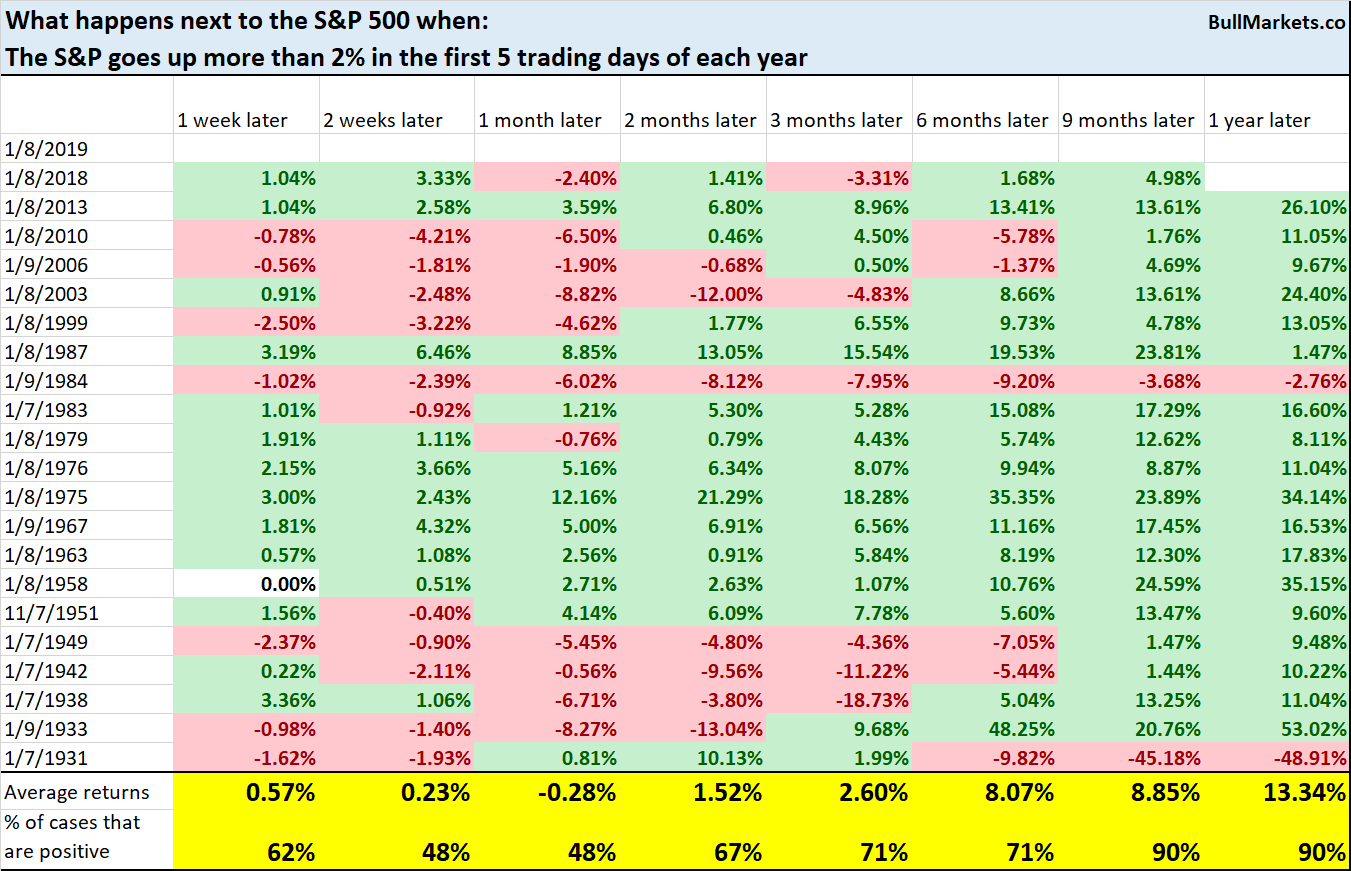
The stock market’s forward returns over the next 2-4 weeks tend to be mixed, but the long term returns (after 9-12 months are bullish). The 2-4 weeks of weakness occurs because January typically starts off strong and then weakens as the month goes on.
Russell 2000 Crash And Reversal
Small caps (Russell 2000) were hit the hardest during the stock market’s decline in Q4 2018.
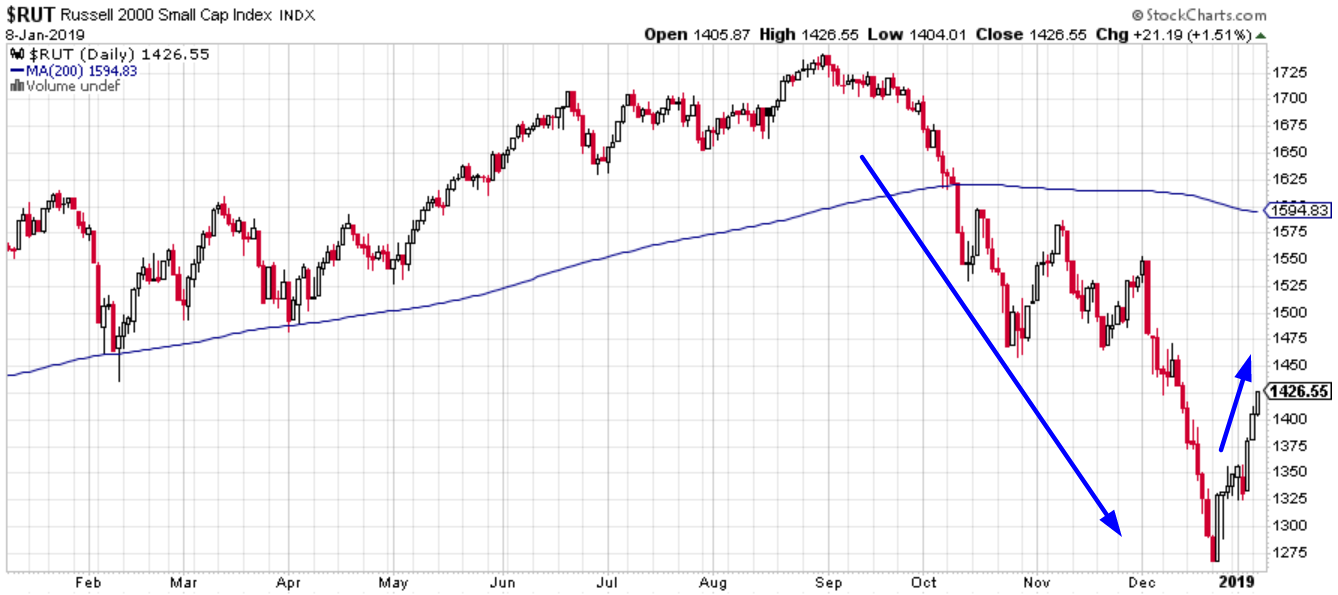
One of our favorite tools for measuring long term mean-reversion is to calculate the market’s distance from its 200-day moving average.
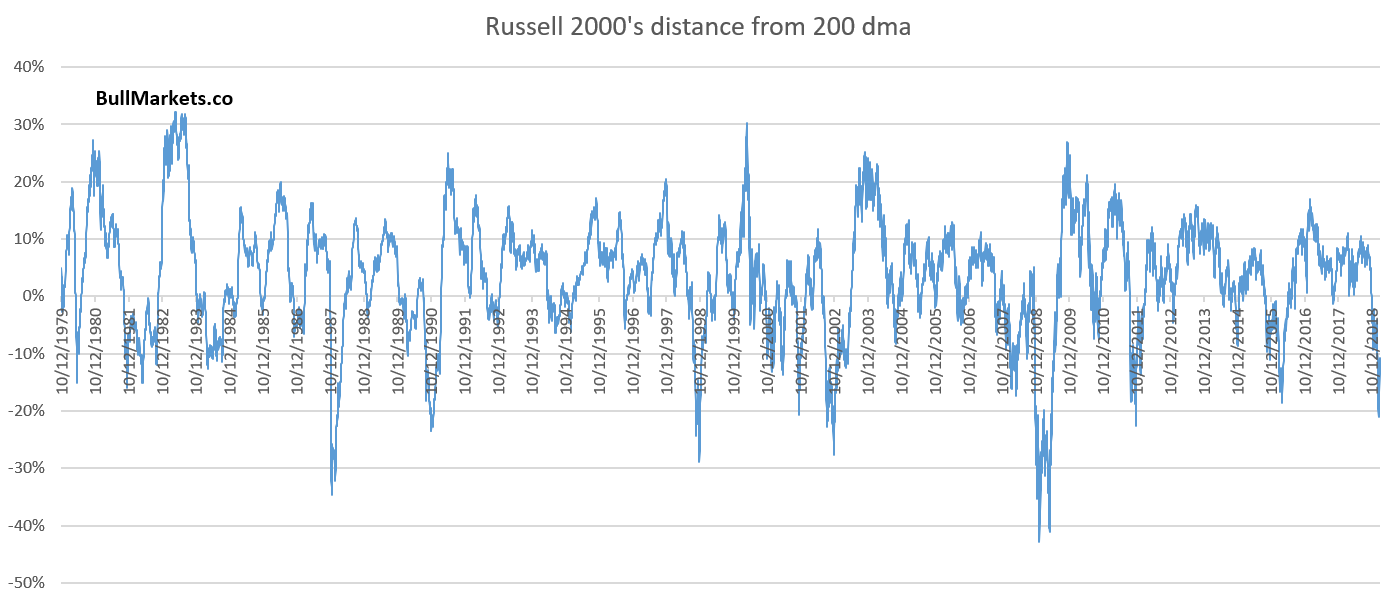
As you can see, the Russell 2000’s decline was indeed epic.
After the crash, the Russell 2000 has gone up 8 of the past 9 days (fierce decline followed by equally persistent rally).
Here’s what happened next to the S&P 500 when it fell more than -20% below its 200 dma, and then rallied at least 8 of the past 9 days.
*Data from 1971 – present

`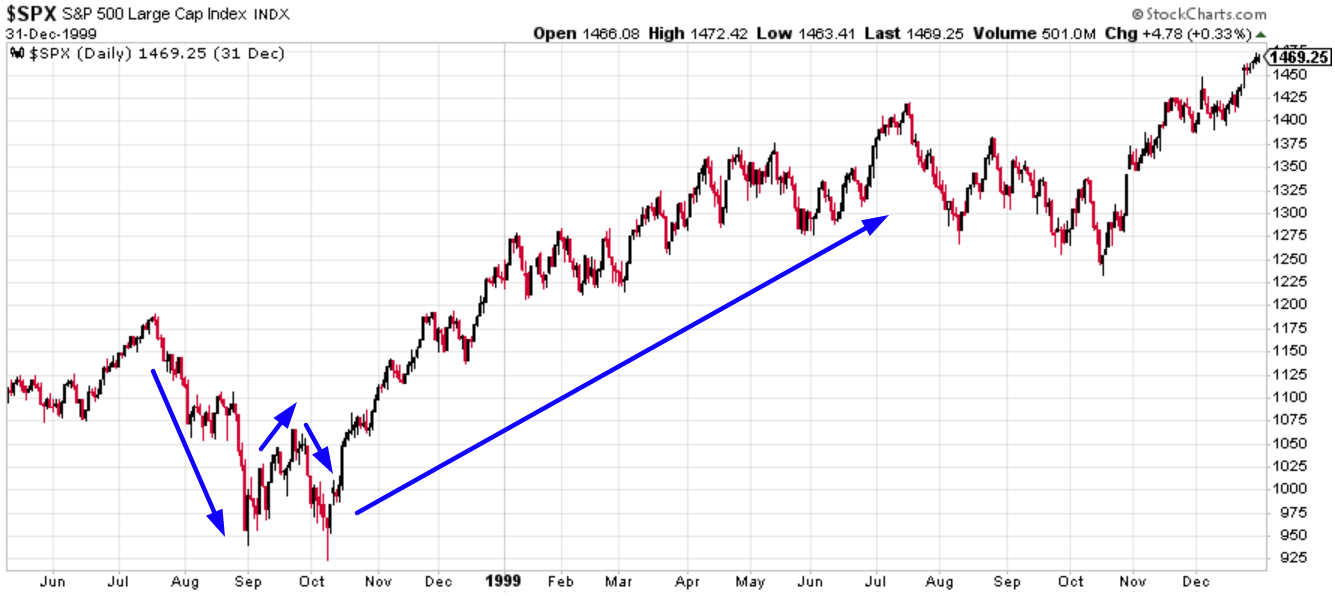
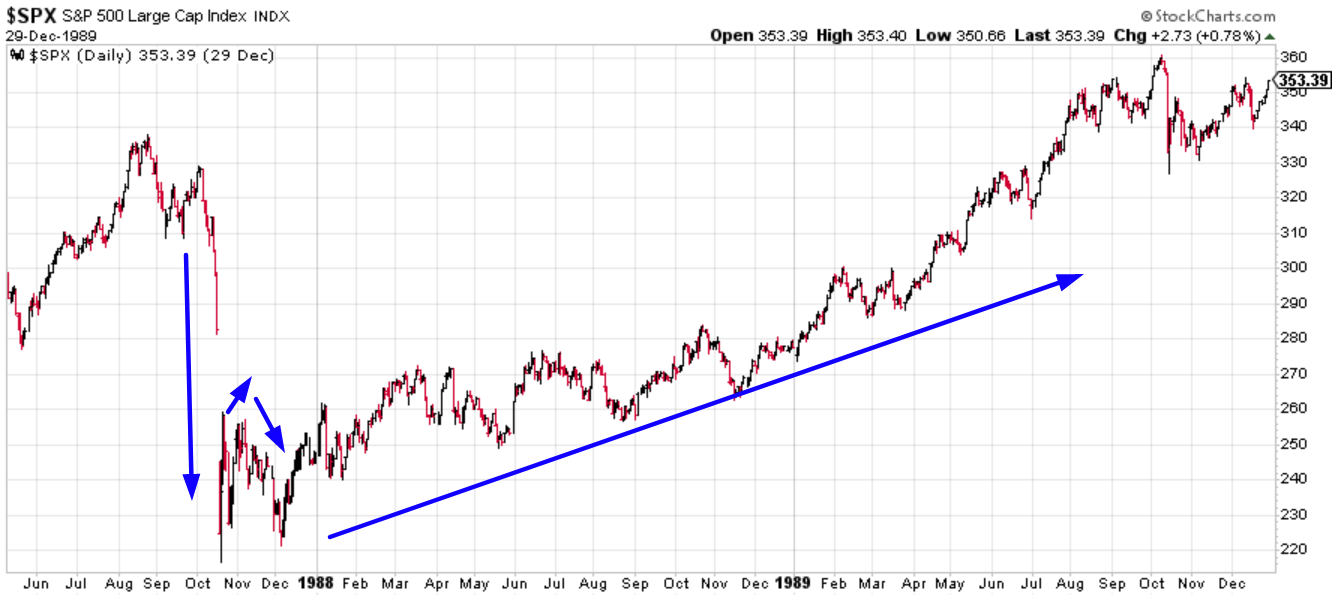
Here’s the really interesting point: the similarities between the stock market today and the stock market in 1987 and 1998 keep piling up. 1987 and 1998 were 20%+ declines that occurred just a few years before a recession. Similarly, no recession today, but we are certainly late-cycle.
- The real big bear markets (1968-1970, 1973-1974, 2000-2002, 2007-2009) all started very slowly.
- It’s the fierce 20% declines followed by equally fierce rallies that usually lead to new all-time highs. (e.g. 1987, 1998, and potentially 2019?)
Oil
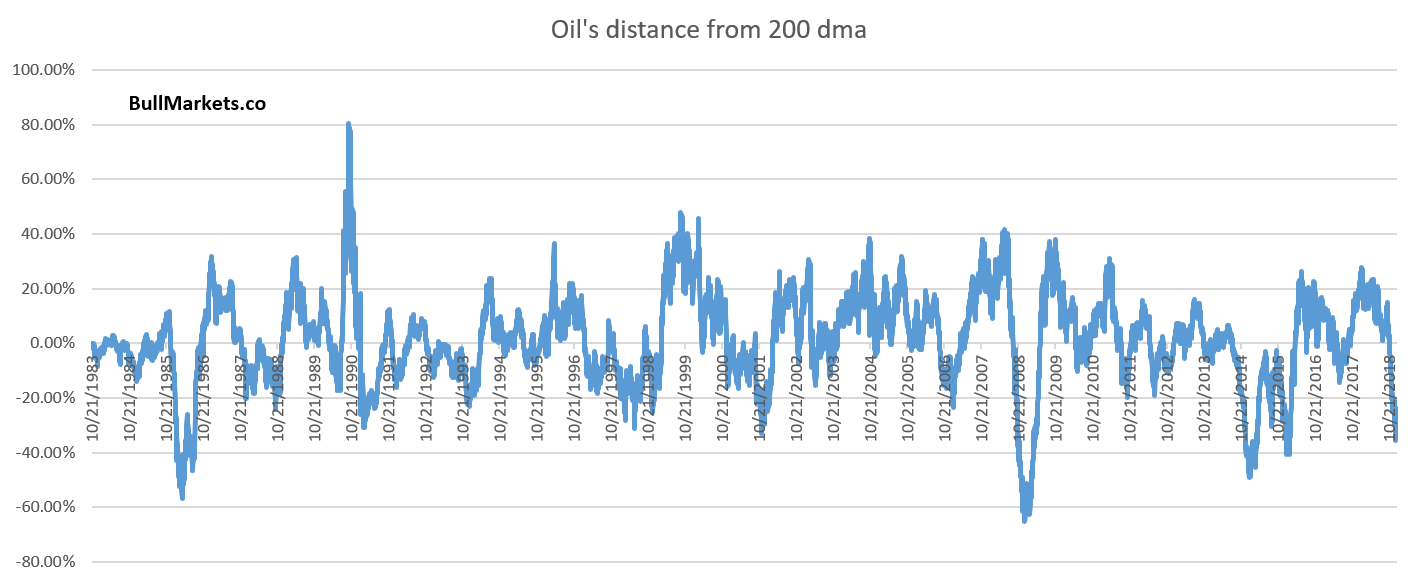
Like the Russell 2000, oil’s decline was epic, and its rally is now equally persistent. (Russell 2000 has a lot of energy companies, which is why the Russell’s collapse was nonstop just like oil’s).
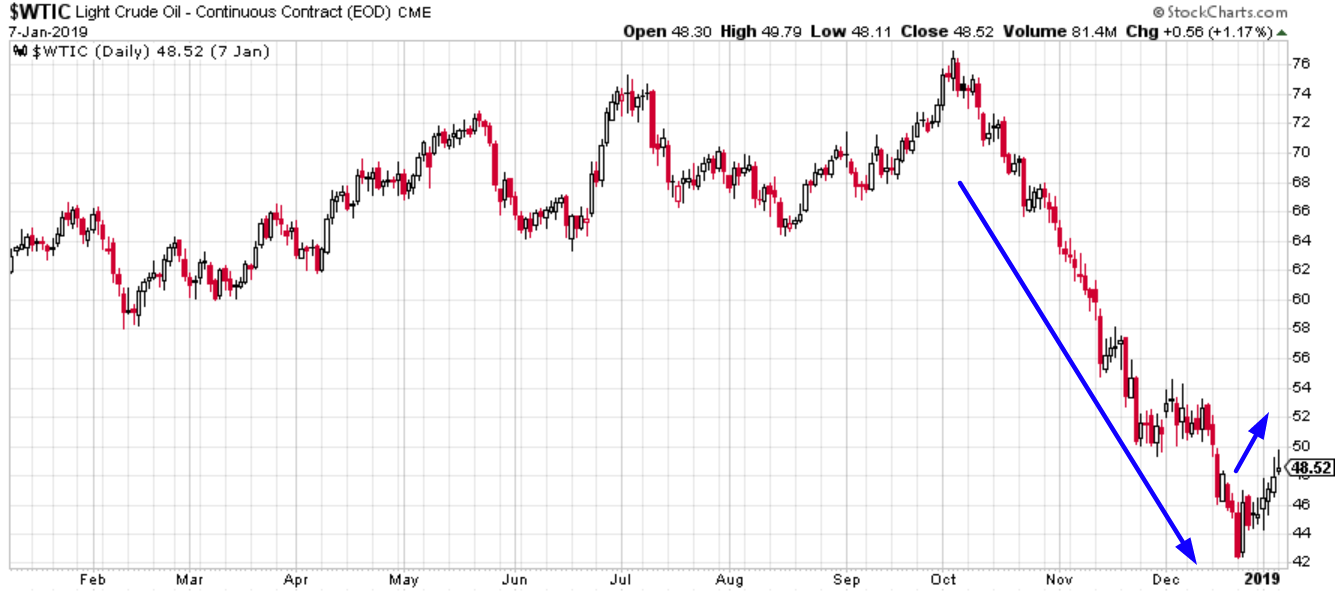
Oil has now gone up 7 days in a row.
Here’s what happened next to oil when it was more than -30% below its 200 dma, and then went up 7 days in a row.

Sample size is small, and forward returns are inconsistent.
Zweig Breadth Thrust
Breadth indicators are very popular, with many traders looking for confirmation, divergences, extremes, etc. We don’t really like breadth indicators because these indicators will become less useful over time. As investors and traders turn away from stock picking and move towards index trading, breadth will become more and more extreme in the decades ahead. So an extreme reading of e.g. -100 in the past is actually much more extreme than a reading of -100 today.
(When you sell SPDR S&P 500 (NYSE:SPY), you are selling every single stock in the S&P, thereby smashing breadth across the board).
But nevertheless, traders seem to have an infatuation with breadth. Like most indicators, breadth indicators have a 50/50 track record unless extreme readings are registered. But when extreme readings are registered, you don’t need breadth either, because ALL contrarian indicators will be at an extreme.
The NYSE Breadth Thrust Index has gone from under 35 to above 60 in less than 2 weeks. This is what traders call a “breadth thrust”, which supposedly “confirms” the market’s bottom.
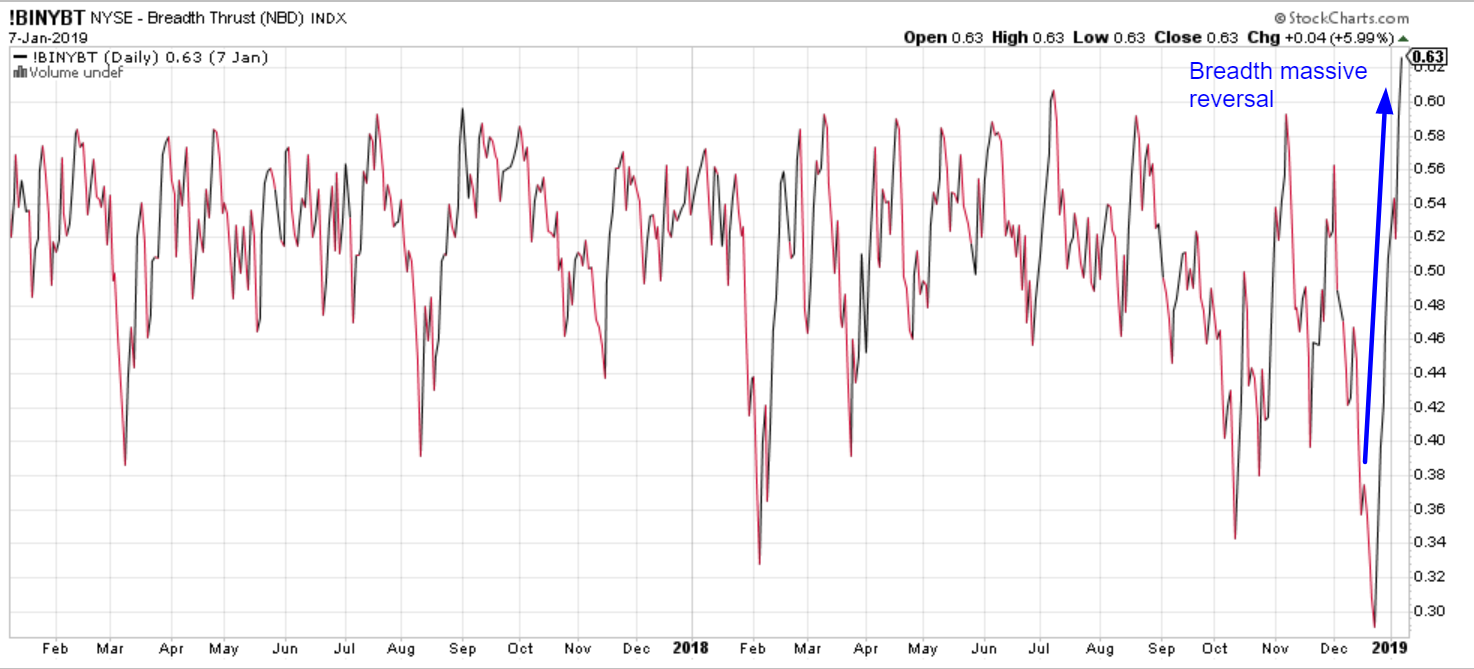
Such breadth thrusts are rare.
From 1970 – present, there have only been 3 other cases in which the NYSE Breadth Thrust Index went from under 35 to above 60 in less than 2 weeks.
All 3 of these cases were long term bullish cases.
NYSE McClellan Oscillator
Other breadth indicators are registering extremes, with the NYSE McClellan Oscillator at its 2nd highest level from 1998-present as the stock market rallies.
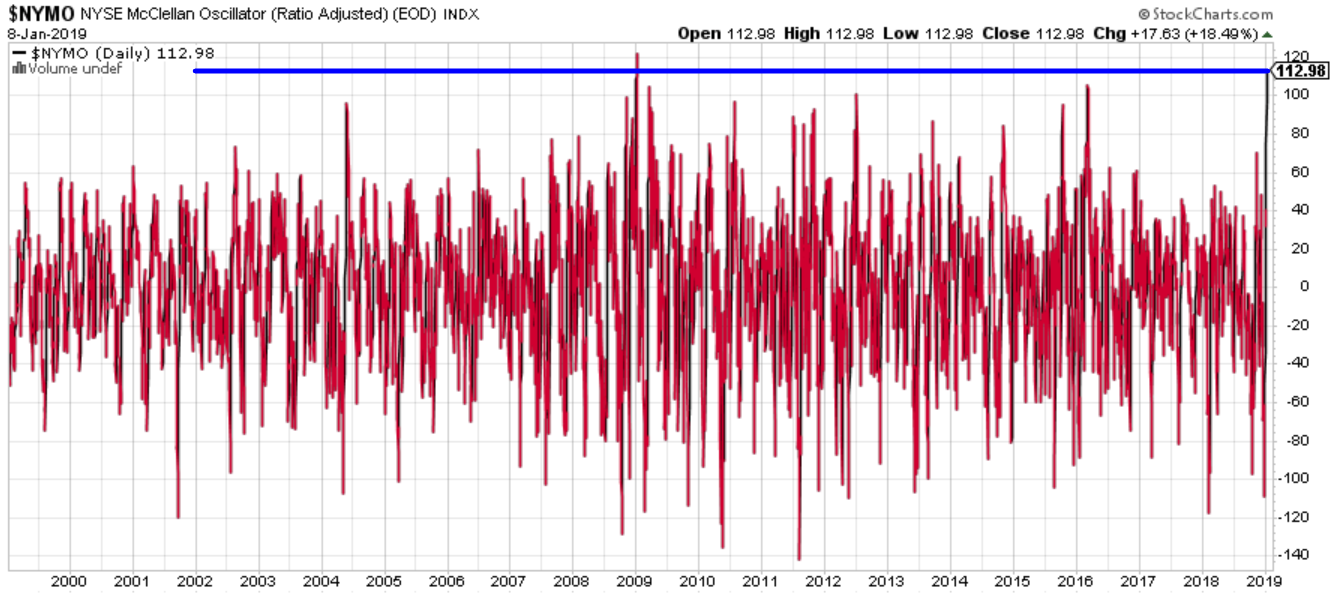
Here’s what the S&P did next in the historical case.

As you can see, the stock market made a 3 month decline before making a much bigger rally (that case was the start of a new bull market).
NASDAQ McClellan Oscillator
Like the NYSE McClellan Oscillator, the NASDAQ McClellan Oscillator is at its highest level from 1998 – present
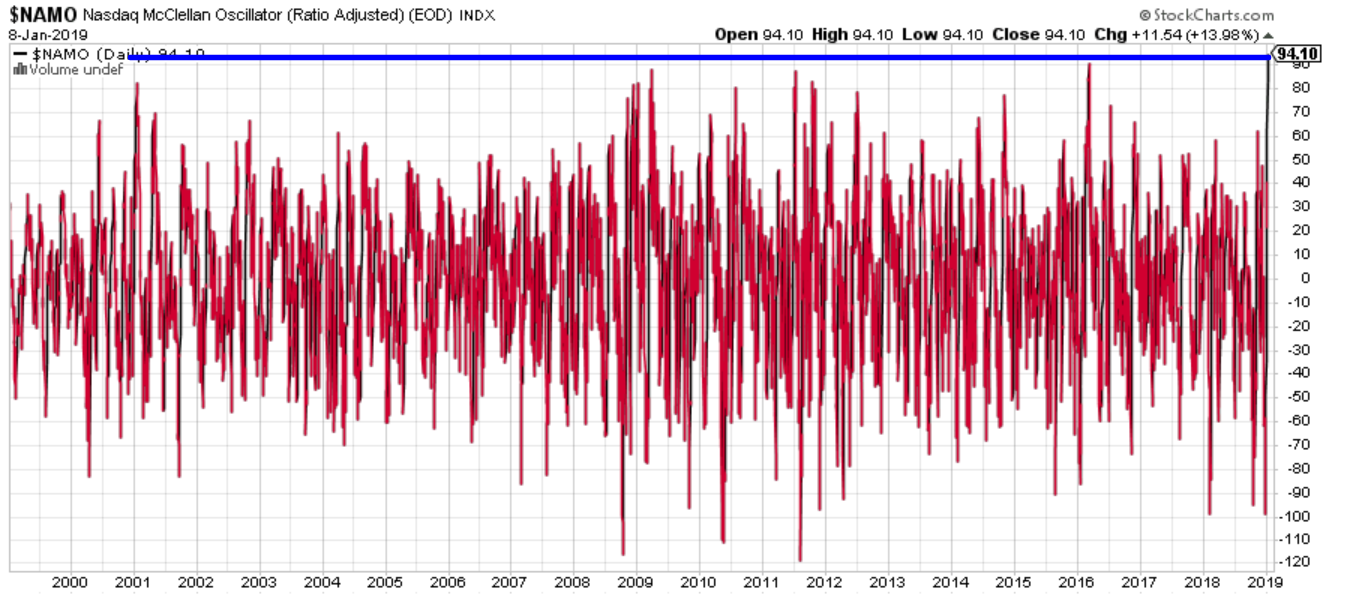
Here’s what the S&P did next in the only other similar historical case.

What you can see is that such strong breadth readings only happen after the stock market collapses and rallies.
Lots of low sample size extremes
The stock market’s crash in Q4 2018 was rare due to its speed, and now its rally is equally persistent. Extremes occur in both directions.
The low sample size in our market studies today merely illustrates how extreme the recent selloff was.
Click here for yesterday’s market study
Conclusion
Here is our discretionary market outlook:
- The U.S. stock market’s long term risk:reward is no longer bullish. This doesn’t necessarily mean that the bull market is over. We’re merely talking about long term risk:reward. Long term risk:reward is more important than trying to predict exact tops and bottoms.
- The medium term direction is still bullish (i.e. trend for the next 6 months). However, if this is the start of a bear market, bear market rallies typically last 3 months. They are shorter in duration.
- The stock market’s short term has a slight bearish lean. Focus on the medium-long term because the short term is extremely hard to predict.
Goldman Sachs’ Bull/Bear Indicator demonstrates that while the bull market’s top isn’t necessarily in, risk:reward does favor long term bears.
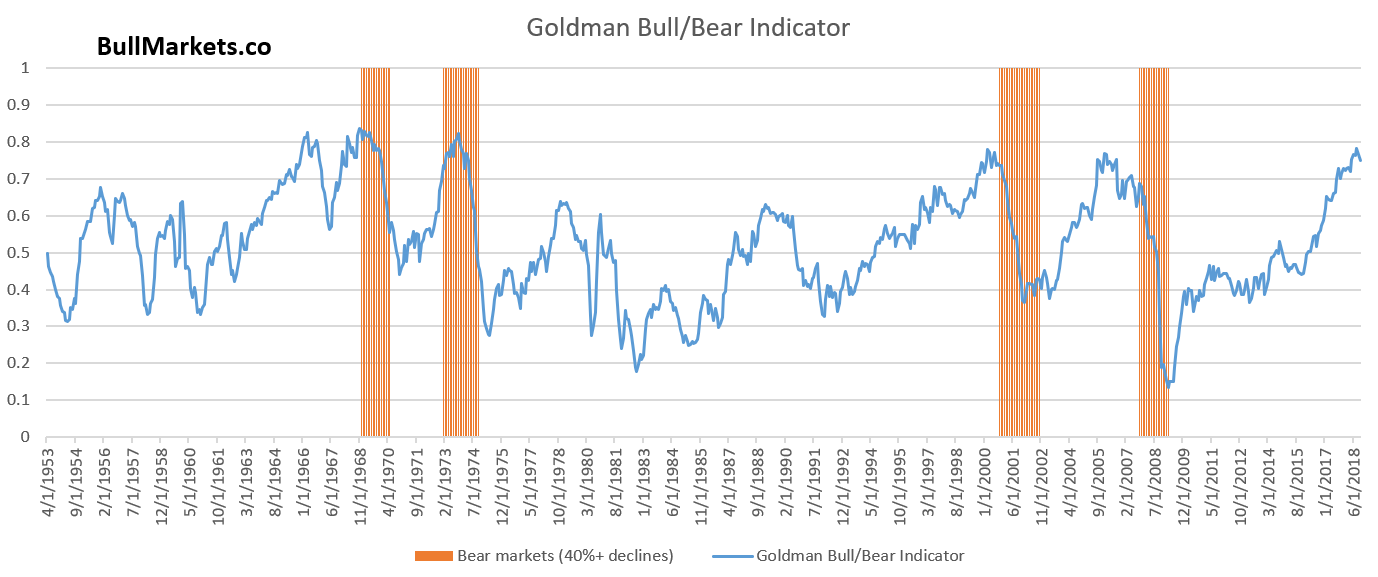
Our discretionary outlook is not a reflection of how we’re trading the markets right now. We trade based on our quantitative trading models.
