
Jack in the Box Inc. (NASDAQ:JACK) reported fourth-quarter fiscal 2019 results, wherein earnings came in line with the Zacks Consensus Estimate but revenues missed the same.
Following the quarterly results, shares of the company gained 2.8% in after-hours trading on Nov 20.
Adjusted earnings from continuing operations came in at 95 cents per share, in line with the Zacks Consensus Estimate and increased 23.4% on a year-over-year basis. However, total revenues of $221.2 million marginally missed the consensus mark of $221.8 million but improved 24.7% year over year.
Comps Discussion
Comps at Jack in the Box’s stores rose 3.5% compared with the prior-year quarter’s 0.8% growth. This uptick can be attributed to average check and transactions growth of 2.8% and 0.7%, respectively. In third-quarter fiscal 2019, the company had reported 2.8% comps growth.
Same-store sales at franchised stores increased 3% compared with a 0.4% gain in the prior-year quarter. In the last reported quarter, the metric was up 2.7%. Meanwhile, system-wide same-store sales improved 3% compared with a 0.5% increase in the year-ago quarter. In third-quarter fiscal 2019, system-wide same-store sales rose 2.7%.
Operating Highlights
Restaurant-level adjusted margin contracted 190 bps in the fourth quarter from the year-ago quarter to 24.2%. The downside was primarily due to wage and commodity inflation, which benefits from refranchising and decline in maintenance as well as repair expenses. Also, food and packaging costs increased 30 basis points owing to higher ingredient costs. Franchise level margin was 41.1% compared with 58.6% in the prior-year quarter.
Jack In The Box Inc. Price, Consensus and EPS Surprise
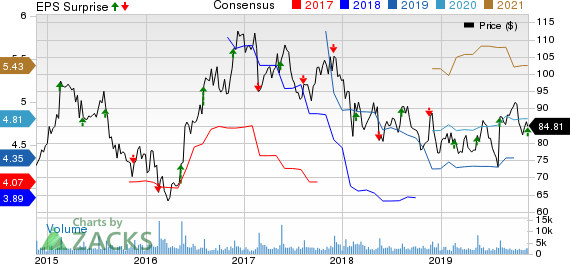
Jack In The Box Inc. price-consensus-eps-surprise-chart | Jack In The Box Inc. Quote
Balance Sheet
As of Sep 29, 2019, cash totaled $125.5 million compared with $2.7 million as of Sep 30, 2018. Inventories in the quarter under review amounted to $1.8 million. Long-term debt summed $1,274.4 million as of Sep 29, 2019, compared with $1,037.9 million at the end of Sep 30, 2018. Cash flows from operating activities increased to $168.4 million in the fourth quarter from $104 million at the prior-year quarter end.
Jack in the Box repurchased 1.4 million shares worth $125.3 million in the fourth quarter. Currently, it has $109 million left under the current authorization. Moreover, on Nov 15, 2019, the company announced an additional $100 million share repurchase program, which will expire in November 2021.
2020 Outlook
For fiscal 2020, comps at Jack in the Box’s system restaurants are envisioned to increase nearly 1.5-3%. Meanwhile, the company expect Restaurant-Level margin of nearly 25%.
Adjusted EBITDA is anticipated between approximately $265 million and $275 million. Capital expenditures are estimated roughly in the $45-$55 million range.
Jack in the Box currently has a Zacks Rank #3 (Hold). You can see the complete list of today’s Zacks #1 Rank (Strong Buy) stocks here.
Peer Releases
Dunkin' Brands Group, Inc. (NASDAQ:DNKN) reported mixed results in third-quarter 2019, wherein earnings surpassed the Zacks Consensus Estimate but revenues lagged the same. Its adjusted earnings of 90 cents per share outpaced the consensus estimate of 81 cents by 11.1%. Revenues were up 1.7% year over year to $355.9 million but missed the consensus mark of $359 million.
Brinker International, Inc. (NYSE:EAT) reported mixed first-quarter fiscal 2020 results, wherein earnings were in line with the Zacks Consensus Estimate but revenues lagged the same. Adjusted earnings of $41 cents per share declined 12.8% from the year-ago quarter, mainly due to increase in stock-based compensation expenses for newly retired executives. Quarterly revenues totaled $786 million, which missed the consensus mark of $788 million but improved 4.3% on a year-over-year basis.
Chipotle Mexican Grill, Inc. (NYSE:CMG) reported third-quarter 2019 results, wherein earnings and revenues surpassed the respective Zacks Consensus Estimate. The company’s adjusted earnings of $3.82 per share surpassed the Zacks Consensus Estimate of $3.20. The bottom line also improved 76.9% from the year-ago quarter, driven by increased revenues and strong operating margins. Quarterly revenues of $1.4 billion outpaced the consensus estimate by 1.8% and improved 14.6% year over year.
Just Released: Zacks’ 7 Best Stocks for Today
Experts extracted 7 stocks from the list of 220 Zacks Rank #1 Strong Buys that has beaten the market more than 2X over with a stunning average gain of +24.5% per year.
These 7 were selected because of their superior potential for immediate breakout.
See these time-sensitive tickers now >>
Chipotle Mexican Grill, Inc. (CMG): Free Stock Analysis Report
Brinker International, Inc. (EAT): Free Stock Analysis Report
Jack In The Box Inc. (JACK): Free Stock Analysis Report
Dunkin' Brands Group, Inc. (DNKN): Free Stock Analysis Report
Original post
Zacks Investment Research