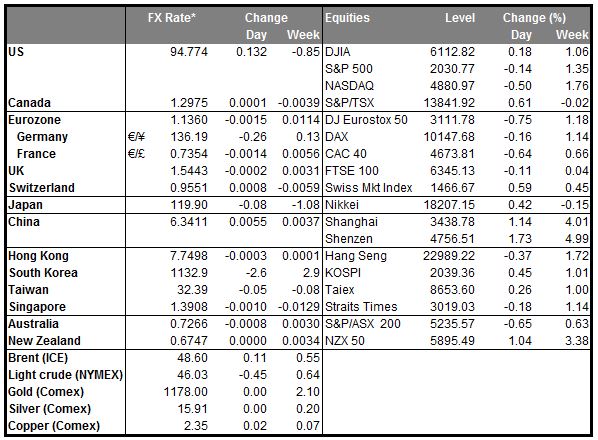
• Bank of Canada rate decision following the elections The highlight will be the Bank of Canada rate decision following the country’s elections. The September policy meeting statement gave no hint that further accommodation was being considered. Overall, they seemed to be satisfied with the impact of their recent reduction in rates and happy to remain on hold for some time. As for the currency, they mentioned approvingly that the fall in CAD is “helping to absorb some of the impact of lower commodity prices” and “facilitating the adjustments taking place in Canada’s economy.” As such, we don’t expect any action at this meeting, but we expect the Bank to keep alive the scenario for further cuts in the foreseeable future. That could leave CAD vulnerable in the medium term. The majority election win, however, has removed the risk of a hung parliament and a prolonged period of uncertainty. Therefore, an optimistic statement and a positive tone in the press conference could provide short-term CAD-long opportunities. The Bank also releases the updated quarterly economic forecast and if they continue to believe that growth will pick up towards the end of the year and remain strong in 2016, this could also boost CAD somewhat, at least temporarily.
• US housing data were moderately upbeat The number of housing starts rose more than forecast in September, while the more forward-looking building permits fell below expectations, data showed on Tuesday. It was the sixth straight month that starts remained above 1mn, pointing to a sustainable housing recovery. Although building permits declined from August, the weakness is likely to be temporary amid strong confidence levels among homebuilders. Overall, the data showed that the housing sector continues to steadily improve, even though economic growth has slowed recently.
• Overnight, Japan’s trade deficit narrowed in September, but exports fell short of expectations. Japan’s trade balance has improved recently with the lower energy prices, but the slowdown in China and in other EM economies has stalled the recovery in exports. The reaction on USD/JPY was limited at the release and the rate stayed below the psychological 120.00 level.
• New Zealand’s dollar came under increased selling pressure on Tuesday, after the fall in dairy prices in the latest auction. The fall, which followed four consecutive gains pushed NZD/USD below 0.6800. Kiwi has recently being on a rising mode, as investors scaled back expectations for a rate cut by the Reserve Bank of New Zealand at its October policy meeting. (see technical below).
• Today’s highlights: The economic calendar is very light with no significant releases during the European trading session.
• As for the speakers, besides BoC Gov. Poloz, BoE Governor Mark Carney give a lecture in Oxford. Fed Governor Jerome Powell speaks again. He was speaking on Tuesday, but made no comments on monetary policy. So if we see any comments today that the Fed could raise rates this year, this could prove USD-positive.
The Market
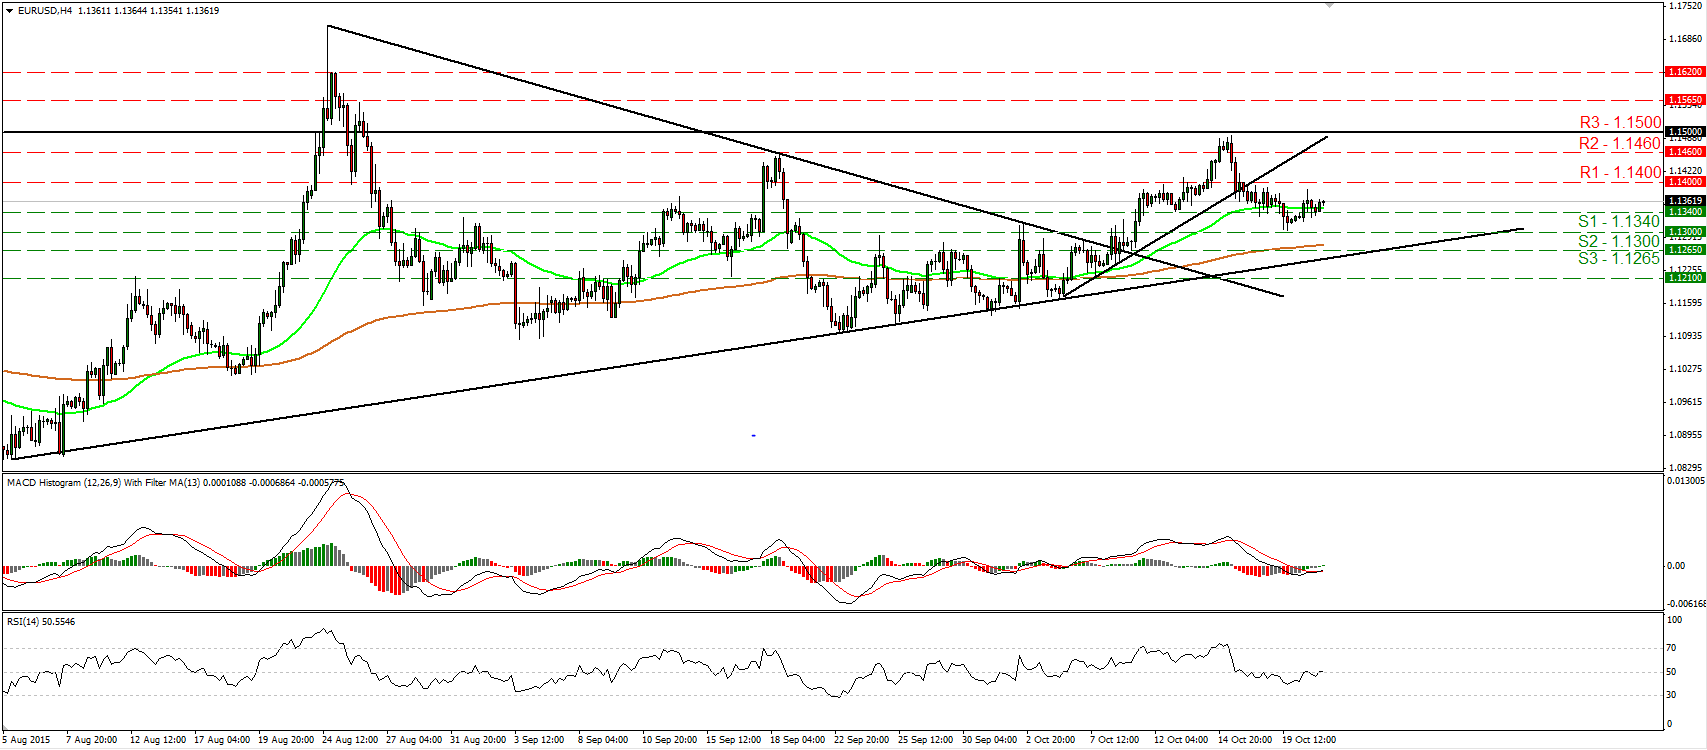
EUR/USD trades lower but finds support at 1.1300
• EUR/USD traded higher yesterday, breaking back above the 1.1340 (S1) line. Although the rate remains below the uptrend line taken from the low of the 6th of October, I still believe that the rebound is likely to continue for a while, perhaps for a test at 1.1400 (R1). A clear move above 1.1400 (R1) could set the stage for the next resistance at 1.1460 (R2). Our short-term oscillators support further rebound as well. The RSI just poked its nose above its trigger line, while the MACD, although negative, has bottomed and crossed above its trigger line. In the bigger picture, as long as EUR/USD is trading between the 1.0800 key support and the psychological zone of 1.1500 (R3), I would maintain my neutral stance as far as the overall picture is concerned. I would like to see another move above 1.1500 before assuming that the overall outlook is positive. On the downside, a break below the 1.0800 hurdle is the move that could shift the picture back negative. • Support: 1.1340 (S1), 1.1300 (S2), 1.1265 (S3) • Resistance: 1.1400 (R1), 1.1460 (R2), 1.1500 (R3)
NZD/USD breaks below an uptrend line
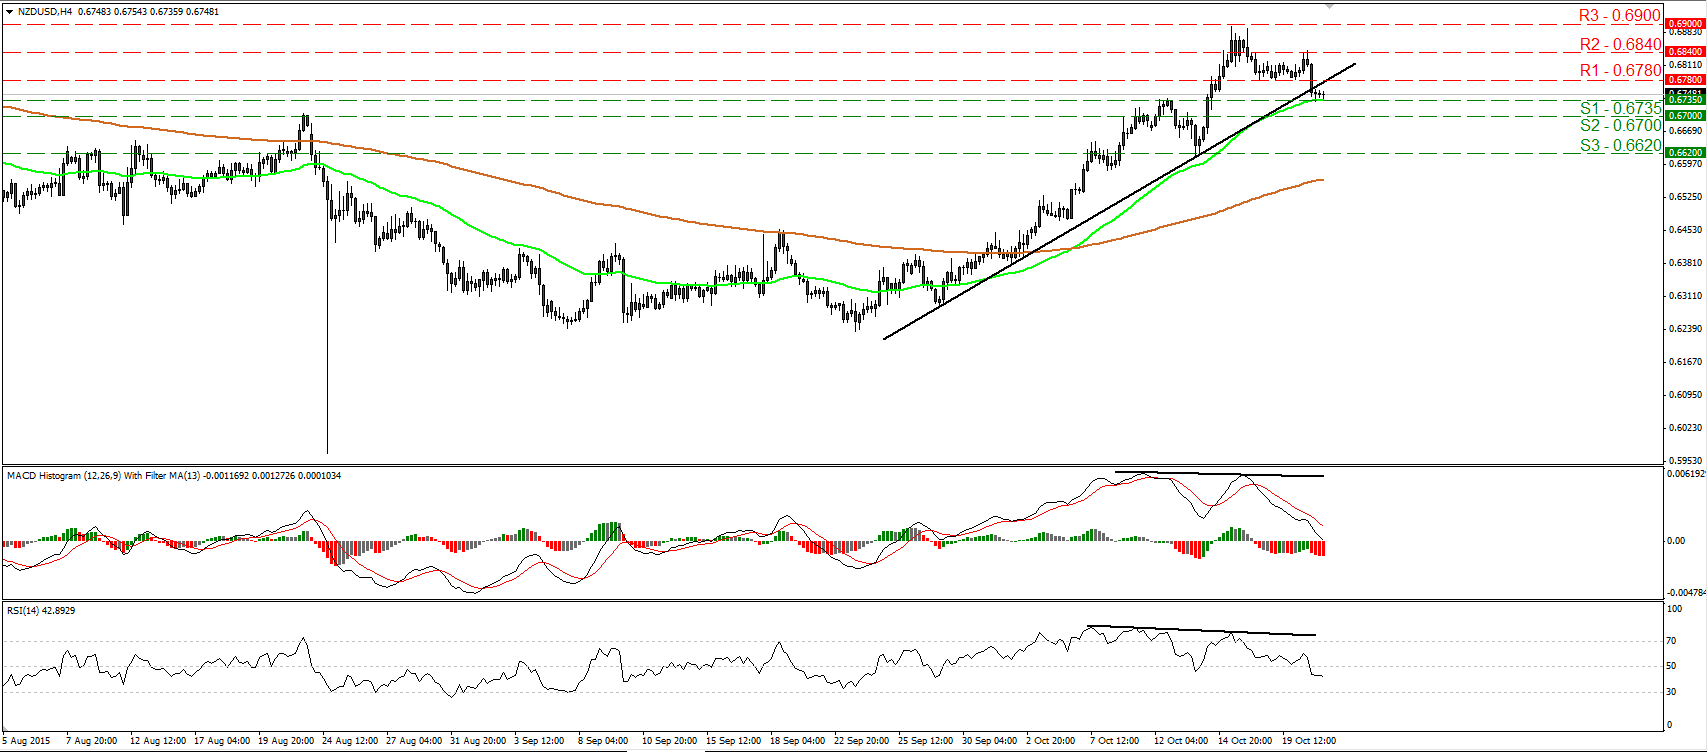
• NZD/USD tumbled yesterday after milk prices slipped in the second auction held this month by New Zealand’s Fonterra Group, the world’s largest dairy exporter. The pair fell below the support (now turned into resistance) of 0.6780 (R1) and below the uptrend line taken from the low of the 29th of September. Nevertheless, the decline was stopped by the 0.6735 (S1) line, near the 50-period moving average. The dip below the trend line confirmed the negative divergence between our oscillators and the price action, and has shifted the short-term bias cautiously negative in my view. A break below 0.6735 (S1) is likely to challenge the 0.6700 (S2) line, where a clear dip could have larger bearish implications and perhaps pave the way for the 0.6620 (S3) zone. On the daily chart, the medium-term picture still looks somewhat positive. As a result, I would treat a possible short-term downtrend as a corrective move for now. • Support: 0.6735 (S1), 0.6700 (S2), 0.6620 (S3) • Resistance: 0.6780 (R1), 0.6840 (R2), 0.6900 (R3)
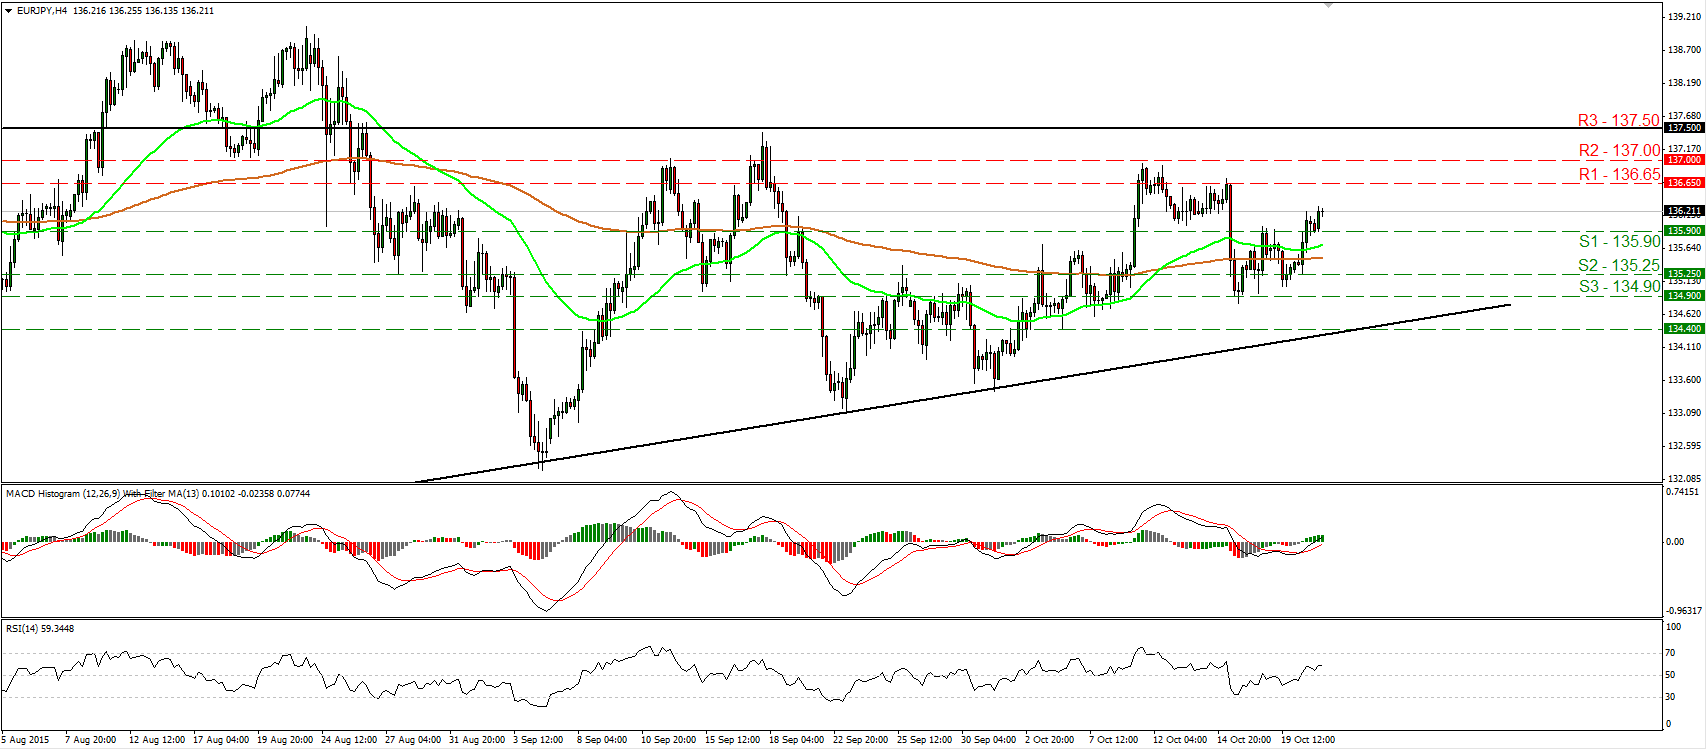
EUR/JPY breaks above 135.90
• EUR/JPY traded higher yesterday, breaking above the resistance (now turned into support) barrier of 135.90 (S1). The move above that hurdle signaled the completion of a failure swing bottom in my view and as a result, I would expect the positive move to continue and challenge the 136.65 (R1) line. A break above that resistance is likely to target the next one at 137.00 (R2). Our short-term oscillators detect positive momentum and support somewhat the notion. The RSI moved higher after it crossed above its 50 line, while the MACD, already above its signal line, has just turned positive. On the daily chart, I see that EUR/JPY is trading above the upside support line taken from the low of the 14th of April. However, I believe that a clear close above 137.50 is needed to confirm a forthcoming higher high and turn the overall outlook somewhat positive. • Support: 135.90 (S1), 135.25 (S2), 134.90 (S3) • Resistance: 136.65 (R1), 137.00 (R2), 137.50 (R3)
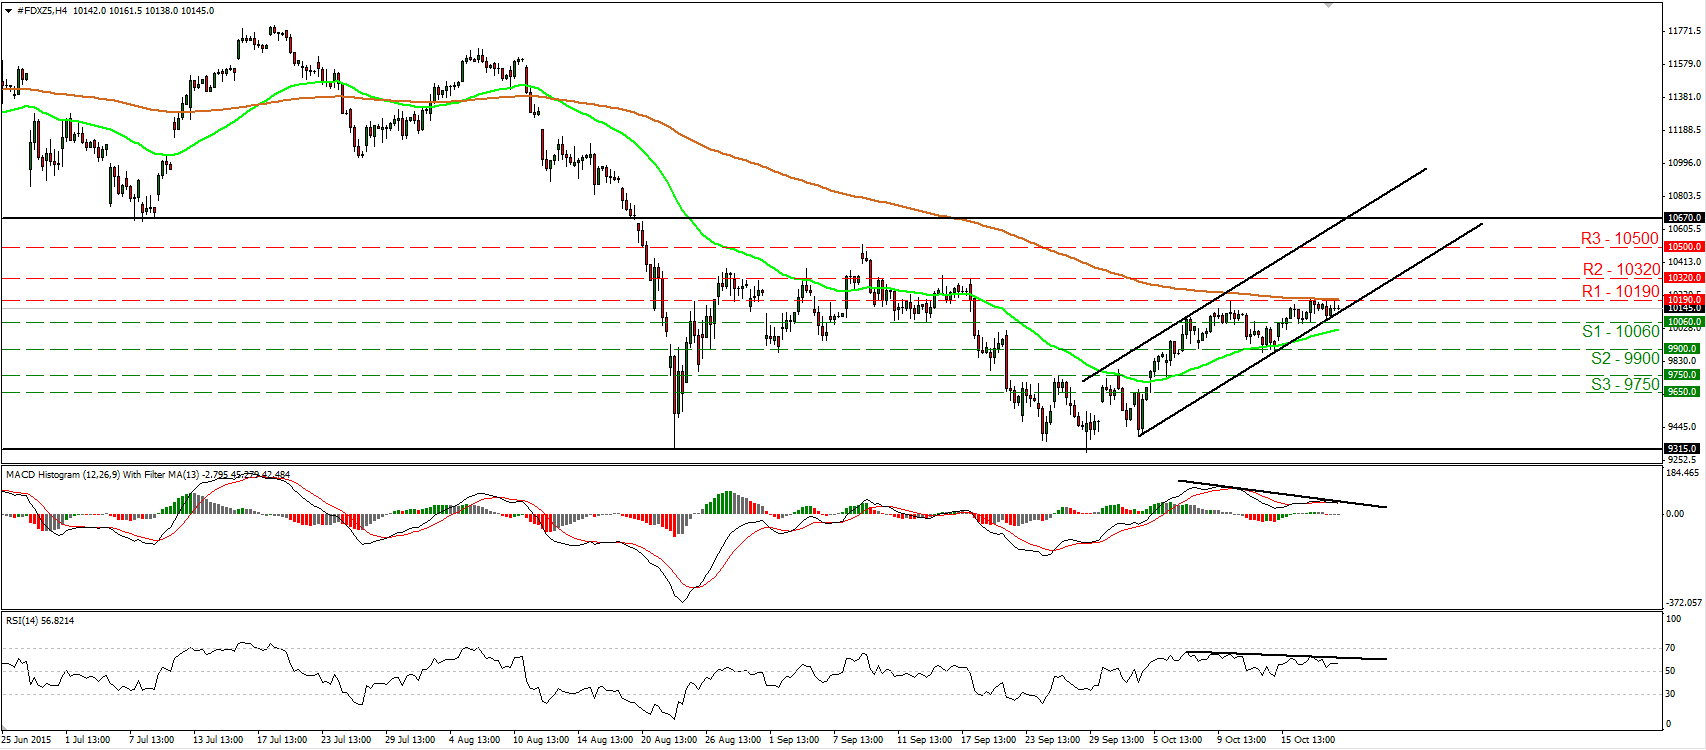
DAX finds it hard to move above 10190
• DAX futures hit resistance at 10190 (R1), which currently coincides with the 200-period moving average. Then the index traded in a consolidative manner staying slightly below that obstacle. Although the price is still trading within an upside channel, I see negative divergence between both our oscillators and the price action. What is more, the RSI looks ready to turn down again, while the MACD, although positive, has topped and fell below its trigger line. Taking into account this momentum signs, I prefer to switch my view to neutral for now. A break above 10190 (R1) could aim for our next resistance at 10320 (R2), while a dip below 10060 (S1) could target the 9900 (S2) support zone. On the daily chart, the break below 10670 on the 20th of August has shifted the medium-term outlook to the downside, in my view. However, given that the index has printed two lows at around 9315, I would maintain a “wait and see stance” as far as the overall picture is concerned as well. • Support: 10060 (S1), 9900 (S2), 9750 (S3) • Resistance: 10190 (R1), 10320 (R2), 10500 (R3)
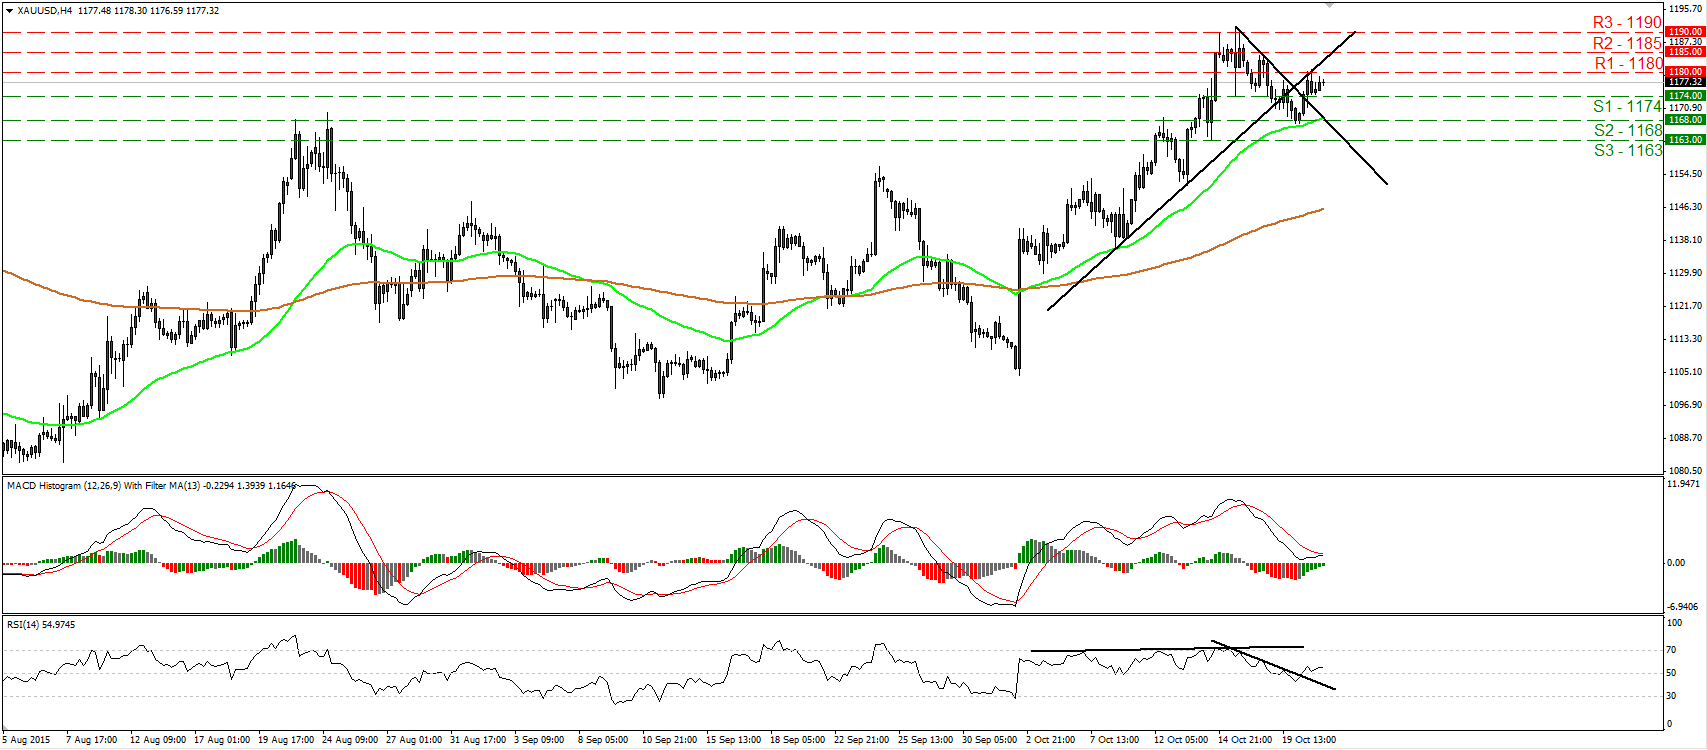
Gold rebounds from near 1168
• Gold traded higher on Tuesday, after it hit support near the 1168 (S2) level. The metal emerged above the short-term downtrend line taken from the peak of the 15th of October, but remained below the uptrend line drawn from the low of the 8th of the month. Taking a look at our oscillators, I see signs that price may continue a bit higher, perhaps for a test near 1185 (R2). The RSI crossed above its downside resistance line and above its 50 line, while the MACD has bottomed and could move above its trigger line soon. On the daily chart, the outlook remains somewhat positive in my view. The precious metal rebounded from the 200-day moving average, but a break above 1190 (R3) is needed to confirm a forthcoming higher high. Something like that could target the psychological zone of 1200. • Support: 1174 (S1), 1168 (S2), 1163 (S3) • Resistance: 1180 (R1), 1185 (R2), 1190 (R3)

