- All Instrument Types
- Indices
- Equities
- ETFs
- Funds
- Commodities
- Currencies
- Crypto
- Bonds
- Certificates
Please try another search

Slightly Bearish View For These 4 Charts As Nonfarm Payrolls Come Into Focus

April’s employment report, to be released this Friday, will almost certainly show that the coronavirus pandemic inflicted the largest one-month blow to the US labor market on record.
We forecast the new report will show that unemployment rose to 12% in April and that employers shed 22 million nonfarm payroll jobs—the equivalent of eliminating every job created in the past decade. The job losses would produce the highest unemployment rate since records began in 1948, eclipsing the 10.8% rate touched in late 1982 at the end of the double-dip recession early in President Reagan’s first term. The monthly number of job losses would be the biggest in records dating back to 1939—far steeper than the 1.96 million jobs eliminated in September 1945, at the end of World War II.
Combined with the rise in unemployment and the loss of jobs in March, the new figures will underscore the labour market’s sharp reversal since February, when jobless rate was at a half-century low of 3.5% and the country notched a record 113 straight months of job creation.
Even so, the count of job cuts and the unemployment rate will appear less dire than implied by the recent surge in people seeking unemployment benefits because of the different ways the figures are tallied. Taken together, the figures paint a grim picture of job losses since the pandemic prompted widespread closures of businesses to curb the spread of infection.
The picture looks worse through the lens of new claims for unemployment benefits—a proxy for layoffs. Workers filed 26.5 million claims for unemployment benefits from March 15 through April 18—the weeks covered by the April jobs report. This is equivalent to 16% of the US labour force seeking aid, suggesting an unemployment rate above 20%.
The measures come from different sources and methodologies. The claim figures reflect the number of people submitting applications through their state labour agencies each week. Those figures may still undercount the total because of processing backlogs in some swamped systems. The Labour Department’s estimates of the unemployment rate and payroll job numbers are based on surveys on the calendar week or pay period including the 12th of the month.
And there was still some hiring in April, including at online retailers, pharmacies and pizza chains. The coronavirus-induced shock caused about 3 new hires for every 10 layoffs, according to researchers at Federal Reserve Bank of Atlanta.
Also, many people who have been laid off because of recent business closures—at hotels, stores, restaurants and the like—aren’t actively looking for other jobs because such employers aren’t hiring or the workers are either ill, caring for sick relatives or worried about the risk of infection. These people won’t be counted in the April unemployment rate because they are not officially part of the labor force.
Friday’s report could show whether Americans expect to return to their jobs. The March report showed that 47% of those who recently lost their job were on temporary layoff, up from 29% in February. How employment will shift in the coming months remains unclear. Key determining factors include the reopening mechanisms taken by the states, the efficacy of federal programs in preserving jobs and how fast the economy recovers.
Our Picks
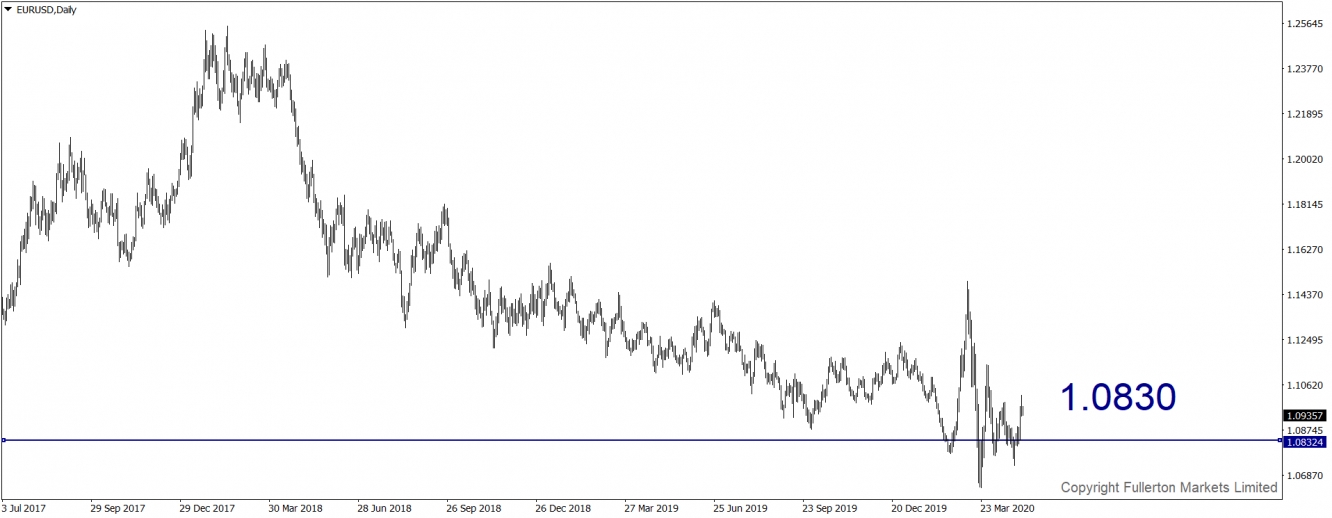
EUR/USD – Slightly Bearish
This EUR/USD pair may fall towards 1.0830 this week.
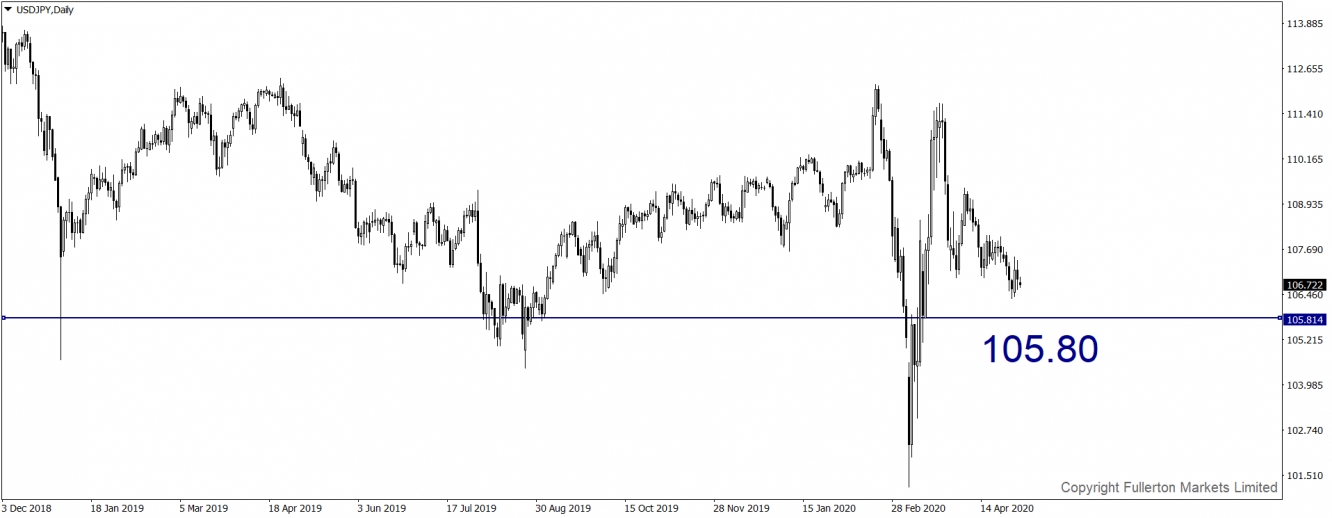
USD/JPY – Slightly Bearish
This USD/JPY pair may fall towards 105.80.
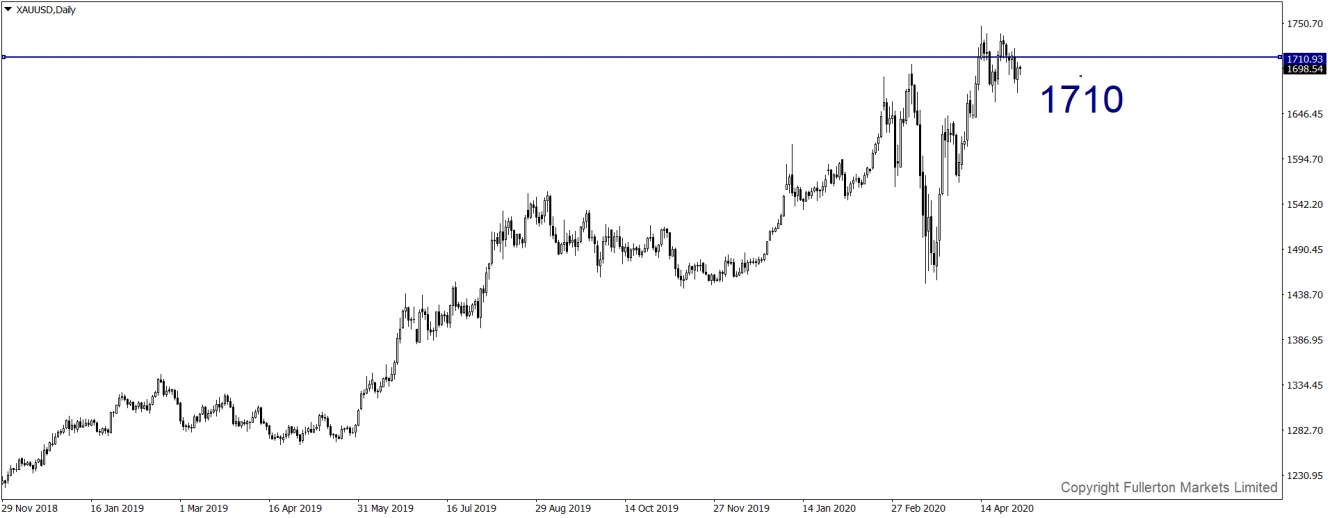
XAU/USD (Gold) – Slightly Bullish
We expect the price of XAU/USD to rise towards 1710 this week.
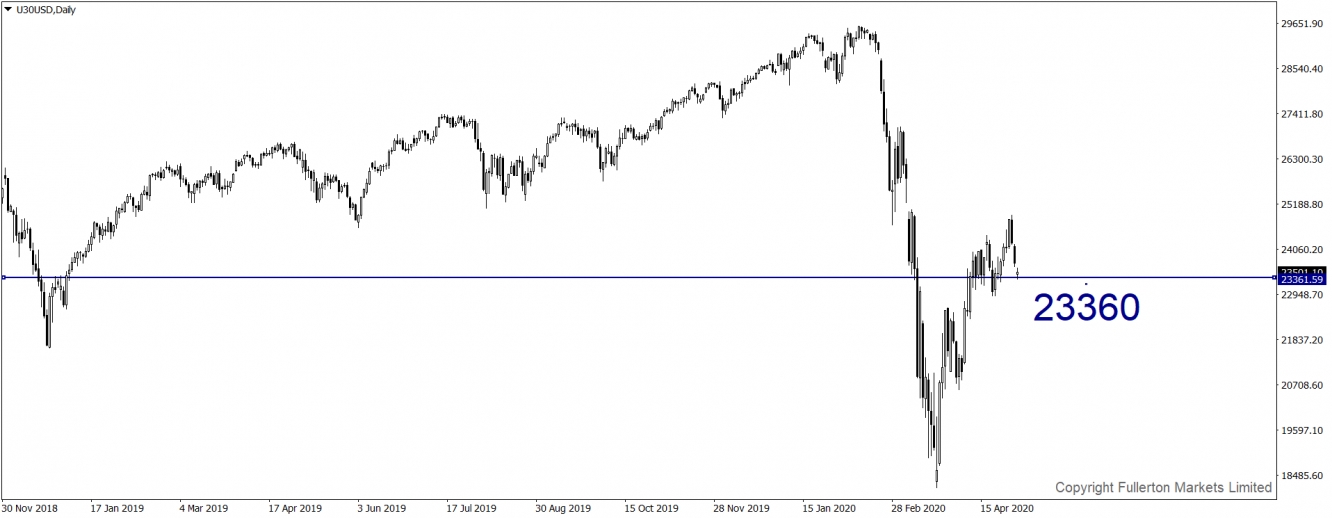
U30USD (Dow) – Slightly Bearish
Dow Jones 30 Futures Index may fall towards 23360 this week.
Related Articles

This will be one of the busier weeks of the year with earnings, the Fed, lots of data, and a Treasury Quarterly Refunding announcement. There are many differing views on the QRA,...

The Biggest MYTH of Trading is that more trading equals more money.Overtrading is one of the most dangerous trading behaviors.

On 30 April – 1 May, the Federal Open Market Committee (FOMC) of the U.S. Federal Reserve (Fed) will meet to decide on key interest rates in the U.S. economy. The Fed is...
Are you sure you want to block %USER_NAME%?
By doing so, you and %USER_NAME% will not be able to see any of each other's Investing.com's posts.
%USER_NAME% was successfully added to your Block List
Since you’ve just unblocked this person, you must wait 48 hours before renewing the block.
I feel that this comment is:
Thank You!
Your report has been sent to our moderators for review


Add a Comment
We encourage you to use comments to engage with other users, share your perspective and ask questions of authors and each other. However, in order to maintain the high level of discourse we’ve all come to value and expect, please keep the following criteria in mind:
Enrich the conversation, don’t trash it.
Stay focused and on track. Only post material that’s relevant to the topic being discussed.
Be respectful. Even negative opinions can be framed positively and diplomatically. Avoid profanity, slander or personal attacks directed at an author or another user. Racism, sexism and other forms of discrimination will not be tolerated.
Perpetrators of spam or abuse will be deleted from the site and prohibited from future registration at Investing.com’s discretion.