
Intercontinental Exchange, Inc.’s (NYSE:ICE) average daily volume (ADV) in June decreased 0.3% to 6.3 million largely attributable to lower Financial ADV. However, higher Commodities ADV partially offset the decline. The company reported 3.3% year-over-year decrease in Financials volume that dropped to 3 million contracts per day. There were 20 trading days in June.
Agriculture and Metals ADV of 0.5 million contracts improved 1.8%. Energy volume too increased 2.7% to 2.8 million contracts per day. Commodities ADV increased 2.6% to 3.3 million in June.
Interest Rate volume decreased 3.8% to 2.3 million contracts per day whereas Equity Index volume slipped 0.2% to 0.6 million contracts. Foreign exchange volume increased 14.7% to nearly 0.04 million contracts.
Revenues per contract were 12 cents for the month, down 7.8% year over year.
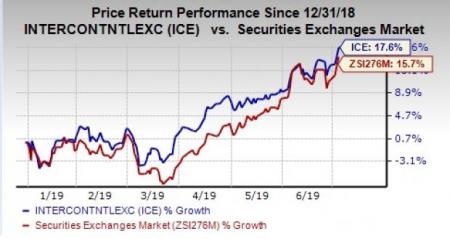
Shares of Intercontinental Exchange have outperformed the industry year to date. The stock has rallied 17.6% compared with the industry’s increase of 15.7%. The company’s compelling product portfolio, along with a broad range of risk management services, strategic buyouts and a robust capital position will likely help the stock retain its growth momentum.
Intercontinental Exchange is set to report second-quarter results on Aug 1. The Zacks Consensus Estimate for quarterly earnings is pegged at 91 cents, indicating year-over-year decrease of 1.1%. Our proven model shows that the company is likely to beat on earnings this time around. This is because it has the right combination of a Zacks Rank #2 (Buy) and an Earnings ESP of +0.91%. The company delivered positive surprise in the last four reported quarters. You can uncover the best stocks to buy or sell before they are reported with our Earnings ESP Filter.
Recently, MarketAxess Holdings Ltd. (NASDAQ:MKTX) , CME Group Inc. (NASDAQ:CME) and Cboe Global Markets, Inc. (NYSE:CBOE) reported trading volume for June 2019. While MarketAxess reported trading volume of $182.9 billion for the month, Cboe Global posted ADV of 7.3 million contracts, up 0.6% year over year. CME Group reported record ADV in Agricultural Commodities, Metals, Interest Rate options and Metals options for June 2019. Options volume of 5.7 million contracts surged 63%.
You can see the complete list of today’s Zacks #1 Rank (Strong Buy) stocks here.
Breakout Biotech Stocks with Triple-Digit Profit Potential
The biotech sector is projected to surge beyond $775 billion by 2024 as scientists develop treatments for thousands of diseases. They’re also finding ways to edit the human genome to literally erase our vulnerability to these diseases.
Zacks has just released Century of Biology: 7 Biotech Stocks to Buy Right Now to help investors profit from 7 stocks poised for outperformance. Our recent biotech recommendations have produced gains of +98%, +119% and +164% in as little as 1 month. The stocks in this report could perform even better.
See these 7 breakthrough stocks now>>
MarketAxess Holdings Inc. (MKTX): Free Stock Analysis Report
CME Group Inc. (CME): Free Stock Analysis Report
Intercontinental Exchange Inc. (ICE): Free Stock Analysis Report
Cboe Global Markets, Inc. (CBOE): Free Stock Analysis Report
Original post
Zacks Investment Research