
Inogen, Inc. (NASDAQ:INGN) recently announced preliminary results for fourth quarter and full-year 2019.
Notably, full-year revenues are expected within the band of $361.4-$362.4 million, suggesting a 0.9-1.2% rise from 2018. The Zacks Consensus Estimate stands at $373.1 million, above the given range.
For the fourth quarter, revenues are expected at $78.9 million, indicating a decline from $86.5 million in the year-ago quarter. The metric also lags the Zacks Consensus Estimate, which is pegged at $90.1 million.
The company expects to release fourth-quarter 2019 results in February.
Content Investors
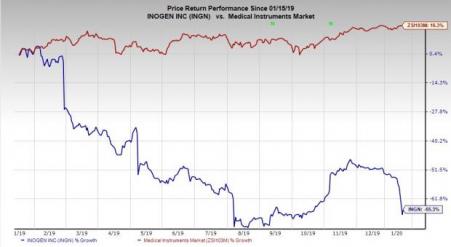
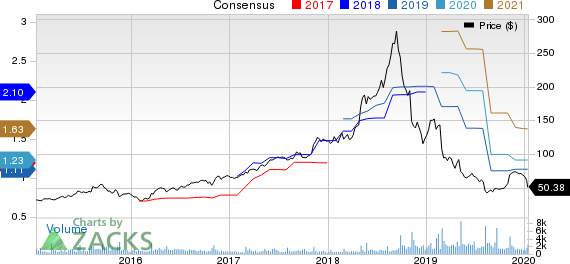
Inogen’s preliminary results have cheered investors. Post the release, shares of this Zacks Rank #3 (Hold) stock have climbed 5.6% to $50.38 at close.
However, over the past year, shares of Inogen have plunged 65.5% against the industry’s 16.5% rally. The S&P 500 index also grew 24.7%.
Quarter Highlights
Per management at Inogen, the company experienced some manufacturing challenges in the fourth quarter, which impacted the domestic business-to-business orders. In the quarter under review, Inogen One G5 is expected to represent more than 40% of total units sold and over 55% of domestic units sold.
Direct-to-consumer sales are expected at $35.8 million, calling for a decline from the prior-year quarter’s $36.8 million. However, Inogen is optimistic about its ability to grow direct-to-consumer sales in 2020.
Domestic business-to-business sales are expected at $20.6 million, suggesting a drop from the year-ago $25.4 million. Meanwhile, international business-to-business sales are expected at $17.1 million versus $18.5 million in the year-ago period. Per management, tender uncertainty in various European regions and currency headwinds impacted overseas revenues.
Rental revenues in the quarter are expected at $5.4 million, indicating a slight decline from the prior-year quarter’s $5.4 million.
Inogen also launched the Tidal Assist Ventilator last month in its direct-to-consumer arm. Additionally, the recent increase in Medicare rates for oxygen therapy is likely to aid Inogen’s 2020 rental revenues and improve the ability of domestic home medical equipment providers to restructure their businesses toward portable oxygen concentrators.
View Slashed
For 2020, Inogen expects revenues within $385-$400 million, calling for 6.4-10.5% growth over 2019. This is below the earlier-projected range of $410-$415 million, suggesting 10.1-11.4% from 2019. The Zacks Consensus Estimate is pinned at $411.5 million, within the guided range.
Notably, the company expects direct-to-consumer sales to be its fastest-growing channel and expects domestic business-to-business and international business-to-business channels to have solid growth rates.
Rental revenues are expected to grow modestly in 2020, while manufacturing challenges are expected to impact the first quarter.
Earnings of Other MedTech Majors at a Glance
Some better-ranked stocks in the broader medical space are Cerner Corporation (NASDAQ:CERN) , DexCom (NASDAQ:DXCM) and HealthEquity (NASDAQ:HQY) . While HealthEquity sports a Zacks Rank #1 (Strong Buy), Cerner and DexCom carry a Zacks Rank #2 (Buy). You can see the complete list of today’s Zacks #1 Rank stocks here.
Cerner’s long-term earnings growth rate is estimated at 13.6%.
DexCom’s fourth-quarter earnings growth rate is projected at 31.5%.
HealthEquity’s long-term earnings growth rate is pegged at 25%.
Today's Best Stocks from Zacks
Would you like to see the updated picks from our best market-beating strategies? From 2017 through Q3 2019, while the S&P 500 gained +39.6%, five of our strategies returned +51.8%, +57.5%, +96.9%, +119.0%, and even +158.9%.
This outperformance has not just been a recent phenomenon. From 2000 – Q3 2019, while the S&P averaged +5.6% per year, our top strategies averaged up to +54.1% per year.
See their latest picks free >>
Cerner Corporation (CERN): Free Stock Analysis Report
Inogen, Inc (INGN): Free Stock Analysis Report
DexCom, Inc. (DXCM): Free Stock Analysis Report
HealthEquity, Inc. (HQY): Free Stock Analysis Report
Original post
Zacks Investment Research