
Illumina, Inc.’s (NASDAQ:ILMN) second-quarter 2019 adjusted earnings per share (EPS) of $1.35 surpassed the Zacks Consensus Estimate by 2.3%. However, the bottom line declined 5.6% from the year-ago quarter’s figure.
Including one-time items, the company reported EPS of $1.99, down 41.1% year over year.
Revenues
In the quarter under review, Illumina’s revenues rose 1% year over year to $838 million. The top line also surpassed the Zacks Consensus Estimate by 0.3%. The year-over-year growth can be attributed to strength across Illumina’s sequencing consumables portfolio, and the high and low throughput categories.
Segment Details
During the second quarter, HiSeq consumables declined due to customers’ transition to NovaSeq. Nevertheless, the overall high throughput consumables portfolio witnessed both sequential and year-over-year growth. NextSeq shipments witnessed sequential and year-over-year growth on the placement of a record number of NextSeq Dx Systems in the quarter.
While Product revenues increased 4.6% year over year to $704 million, Service and Other revenues declined 14.2% year over year to $134 million.
Illumina, Inc. Price, Consensus and EPS Surprise
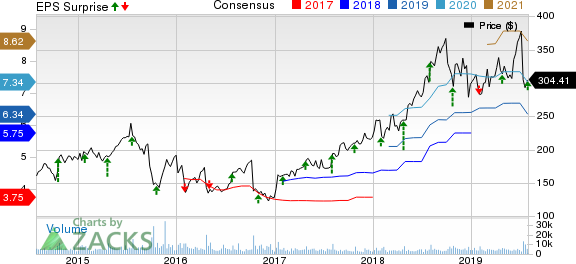
Illumina, Inc. price-consensus-eps-surprise-chart | Illumina, Inc. Quote
Margins
Adjusted gross margin (excluding amortization of acquired intangible assets) was 69.6% in the reported quarter, contracting 79 bps year over year.
Research and development expenses rose 9.9% year over year to $166 million and selling, general & administrative expenses escalated 2.5% to $202 million. The operating margin came in at 25.7%, reflecting a contraction of 278 bps year over year.
Financial Update
Illumina exited the second quarter of 2019 with cash and cash equivalents plus short-term investments of $3.17 billion compared with $3.61 billion at the end of the first quarter. Year-to-date net cash provided by operating activities was $341 million compared with $550 million from the year-ago period.
2019 Guidance
Illumina has lowered its 2019 view. The company now expects revenue growth around 6% compared with the earlier projection of 13-14%. The Zacks Consensus Estimate for 2019 revenues stands at $3.57 billion. Adjusting for certain net specified items with respect to the full year, EPS is estimated to be $6-$6.10 compared with the earlier projection of $6.63-$6.73. The consensus mark for earnings is pegged at $6.34, which lies above the projected range. This outlook excludes any impact from the pending acquisition of Pacific Biosciences that is expected to conclude mid-2019.
Our Take
Illumina exited the second quarter of 2019 on a solid note, with both earnings and revenues beating the Zacks Consensus Estimate. It is encouraging to note that top-line growth was registered across the company’s high and low throughput categories. Furthermore, Illumina continues to showcase robust performance across a broad range of sequencing applications. The launch of the Veriseq NIPT v2 and the company’s partnership with AnchorDx in the second quarter also buoy optimism.
On the flip side, contraction of both margins and a year-over-year decline in service and other revenues are concerns.
Zacks Rank & Key Picks
Illumina currently carries a Zacks Rank #5 (Strong Sell).
A few better-ranked stocks in the broader medical space are Hologic Inc. (NASDAQ:HOLX) , DENTSPLY SIRONA Inc. (NASDAQ:XRAY) and Teleflex Inc. (NYSE:TFX) .
Hologic is scheduled to release second-quarter 2019 results on Jul 31. The Zacks Consensus Estimate for the quarter’s adjusted EPS is pegged at 61 cents and for revenues at $834.6 million. The stock sports a Zacks Rank #2 (Buy). You can see the complete list of today’s Zacks #1 Rank (Strong Buy) stocks here.
DENTSPLY SIRONA is scheduled to release second-quarter 2019 results on Aug 2. The Zacks Consensus Estimate for the period’s adjusted EPS is 62 cents and for revenues $1.03 billion. The stock carries a Zacks Rank #1.
Teleflex is expected to release second-quarter 2019 results on Aug 1. The Zacks Consensus Estimate for adjusted EPS for the to-be-reported quarter is $2.59 and for the top line $636.7 million. The stock has a Zacks Rank of 2.
Today's Best Stocks from Zacks
Would you like to see the updated picks from our best market-beating strategies? From 2017 through 2018, while the S&P 500 gained +15.8%, five of our screens returned +38.0%, +61.3%, +61.6%, +68.1%, and +98.3%. This outperformance has not just been a recent phenomenon. From 2000 – 2018, while the S&P averaged +4.8% per year, our top strategies averaged up to +56.2% per year.
See their latest picks free >>
Teleflex Incorporated (TFX): Free Stock Analysis Report
Hologic, Inc. (HOLX): Free Stock Analysis Report
Illumina, Inc. (ILMN): Free Stock Analysis Report
DENTSPLY SIRONA Inc. (XRAY): Free Stock Analysis Report
Original post
Zacks Investment Research