“Investors have been suffering from diversification deficit disorder. What they thought was diversified has become very highly correlated because of the global integration of the financial markets. Assets we thought were uncorrelated have started to move together, so we have to be much more thoughtful about asset allocation.” – Dr. Andrew W. Lo, founder and portfolio manager, AlphaSimplex Group
Institutional investors are increasingly questioning the common theories of how portfolios are constructed.
Why? …Because we are a long way from 1952 when Modern Portfolio Theory took the drivers seat for investing. And candidly, the model is broken.
In the next few minutes I will show you how broken and in my upcoming Part II, I will show how you can construct balanced portfolios using proven systematic methods.
Let’s start with Natixis Global Associates and the insights they published in a 2010 paper “Post-crisis portfolio construction: Asset allocation in a new era of risk”. Now before your eyes glaze over on this research title … stay with me, it gets good.
Natixis Global Associates found that during the 1980s and 1990s, asset allocation was promoted as a way to optimize returns and lower risk. But there was just one problem … market trends were so broadly positive the strategy was never really put to the test … especially on the downside.
Sure the strategy provided exposure to the BEST performing assets. But it did little to address portfolio protection in down markets.
The conclusion: portfolios should be managed with an eye toward risk-management strategies – nice to see this in print as I’ve been saying the same thing for over a decade.
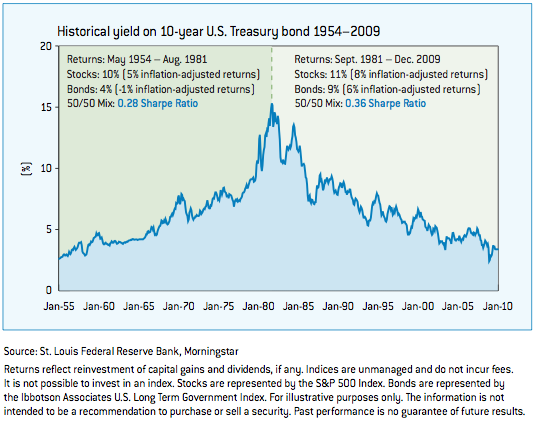
In the past, money managers have managed risks by allocating a percentage of the portfolio to fixed-income securities. This is fine for a long-term secular decline in yield with appreciating high-quality bond prices. Heck, this factor alone has accounted for improving the Sharpe ratio… a universally accepted measure of risk … of balanced strategies for over three decades.
But today’s markets are different!
Investor’s can no longer expect risk-adjusted returns like they’ve had in the past. If they could, interest rates would need to decline further while equity returns would need to approach near normal levels of long-term historical return. And I doubt either is very likely, especially with bond yields already at next-to-nothing.
Deutsche Bank recently published, “Rethinking Portfolio Construction and Risk Management” , by Bradley A. Jones, PhD. Dr. Jones observed how investment strategies—perfectly calibrated to a set of initial conditions—can quickly become extinct when the environment is changed. And as far as I’m concerned, this is exactly what’s happened to the popular application of asset-allocation and equity and fixed income strategies.
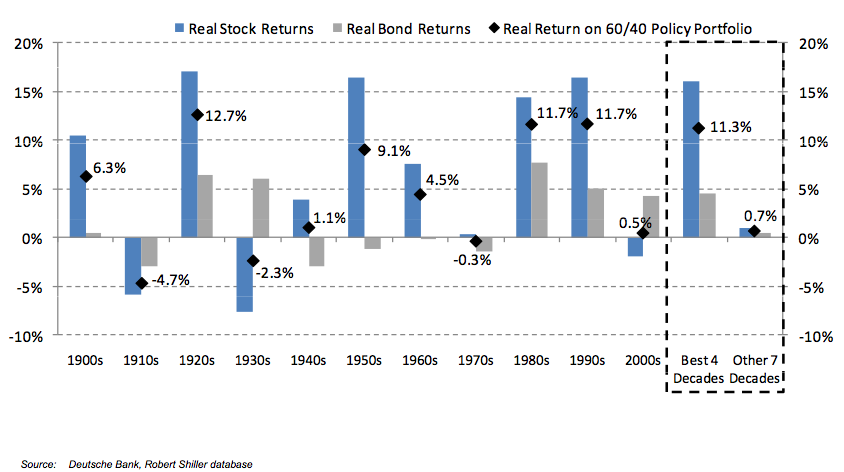
In this particular publication, Dr. Jones took an in depth look at the classic 60-40 portfolio, a long-time staple of investment policy statements. Since 1900, such a policy has generated a real-return of 4.3% – BUT – all of the returns were concentrated in only four decades; the 1920s and ’50s each of which were Post-War Recoveries, and the 1980s and ‘90s which the paper characterized as Windfall Gains. 
In summary, the four best decades had real returns of 11.3% versus the seven other decades in which such a strategy returned on average 0.7%. So where an investor was positioned on the time continuum made a significant difference in what that investor actually experienced. I would argue that very few investors ever achieve “average” results for a whole variety of reasons, this being just one of them.
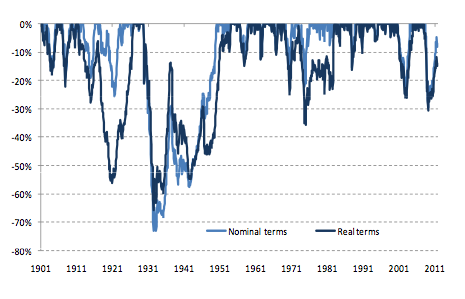
Another conclusion of the study was that large and lengthy drawdowns are par for the course. The 60/40 portfolio mix has suffered a historical drawdowns of as much as -66% with real negative returns 1 in every 3 years and real negative returns of -10% or greater every 1 in 6 years! And incidentally, the risk of loss is ubiquitous across all global markets where the largest drawdown of 60/40 portfolios having ranged from -80% to — 26%.
This information is far from how a balanced strategy is typically depicted.
This paper also reaffirms the earlier beliefs of Natixis, that neither are bond returns going to be anything similar to what recent history has provided nor are equities going to return anything even close to their long-term historical average. In fact, the cited expected return for equities is a mere 2.1% real return.
So why the great variance in results for a strategy often promoted as one that is stable?
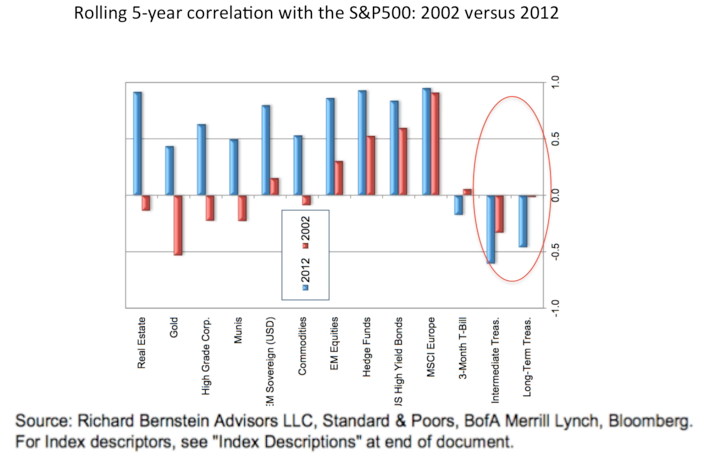
According to Jones, stock and bond correlations are highly regime dependent and far from constant. It turns out, stocks and bonds are positively correlated in 2 out of 3 macro states, thereby minimizing the effects of diversification. In other words, bonds consume a significant amount of the allocation pie with reliably providing a hedge to equities.
Further, risk weights are not the same as dollar weights. Equities account for 95% of portfolio variability in a 60/40 stocks and bonds portfolio.
More recently, Macquarie Private Wealth Group of Toronto—one of the world’s most stable and respected banking groups, has presented a series of articles on “Adaptive Asset Allocation” that utilizes different factors such as volatility and momentum in addition to correlation.
The Macquarie presentation cites a critical flaw in modern portfolio theory — the foundational theory of asset allocation. Specifically, strategic asset allocation uses long-term averages in expected returns, expected correlations, and and expected volatility. But as the previous authors have cited, the long-term averages hide enormous variability over the short and intermediate term horizons that are meaningful for most investors.
In the past 10 years there has been a significant increase in correlation among most asset classes. Said differently … all asset classes have trended together. And this is why asset-allocation failed to insulate investors from the significant declines of ’08-’09. 
And the result of asset allocation—as a investment strategy—has been a “superficial diversification.” Asset allocation misses the payoff from managing diversification based on underlying risk factors or return sources. In other words, diversification should not be based upon just historical correlations over a sample period – because they do and have, change.
In part II of this article, I will discuss some of the solutions cited in the research and how individual investors may construct their own portfolios using some of these ideas.
- English (UK)
- English (India)
- English (Canada)
- English (Australia)
- English (South Africa)
- English (Philippines)
- English (Nigeria)
- Deutsch
- Español (España)
- Español (México)
- Français
- Italiano
- Nederlands
- Português (Portugal)
- Polski
- Português (Brasil)
- Русский
- Türkçe
- العربية
- Ελληνικά
- Svenska
- Suomi
- עברית
- 日本語
- 한국어
- 简体中文
- 繁體中文
- Bahasa Indonesia
- Bahasa Melayu
- ไทย
- Tiếng Việt
- हिंदी
How Institutions Are Changing The Way They Invest And Why You Should Too
Published 06/24/2012, 04:16 AM
Updated 07/09/2023, 06:31 AM
How Institutions Are Changing The Way They Invest And Why You Should Too
3rd party Ad. Not an offer or recommendation by Investing.com. See disclosure here or
remove ads
.
Latest comments
Install Our App
Risk Disclosure: Trading in financial instruments and/or cryptocurrencies involves high risks including the risk of losing some, or all, of your investment amount, and may not be suitable for all investors. Prices of cryptocurrencies are extremely volatile and may be affected by external factors such as financial, regulatory or political events. Trading on margin increases the financial risks.
Before deciding to trade in financial instrument or cryptocurrencies you should be fully informed of the risks and costs associated with trading the financial markets, carefully consider your investment objectives, level of experience, and risk appetite, and seek professional advice where needed.
Fusion Media would like to remind you that the data contained in this website is not necessarily real-time nor accurate. The data and prices on the website are not necessarily provided by any market or exchange, but may be provided by market makers, and so prices may not be accurate and may differ from the actual price at any given market, meaning prices are indicative and not appropriate for trading purposes. Fusion Media and any provider of the data contained in this website will not accept liability for any loss or damage as a result of your trading, or your reliance on the information contained within this website.
It is prohibited to use, store, reproduce, display, modify, transmit or distribute the data contained in this website without the explicit prior written permission of Fusion Media and/or the data provider. All intellectual property rights are reserved by the providers and/or the exchange providing the data contained in this website.
Fusion Media may be compensated by the advertisers that appear on the website, based on your interaction with the advertisements or advertisers.
© 2007-2024 - Fusion Media Limited. All Rights Reserved.
