There are 185 different currencies on planet earth, and the US dollar is the most powerful of all currencies—the world’s reserve currency.
Historic signal
On Mar. 26, the US dollar closed above its 200-day simple moving average (SMA), snapping one of its longest streaks below the 200-day SMA. This could be considered an important milestone. However, on Monday (Apr. 5), the US dollar closed back below its 200-day SMA.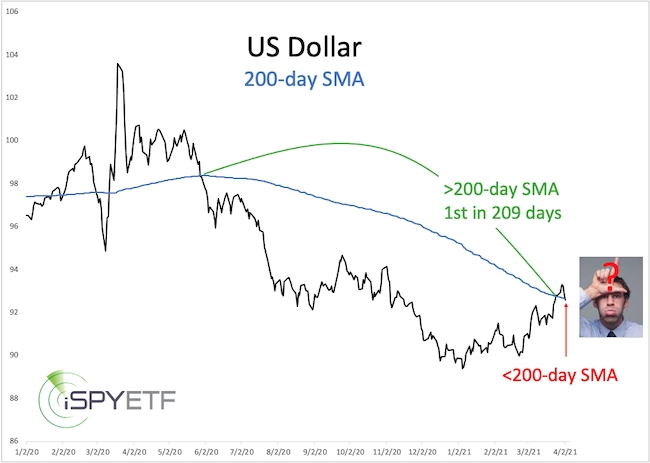
What does this seesaw across the 200-day SMA mean for the dollar? Does it affect other assets, like gold and stocks, and how?
There are many opinions on this topic. What you’ll read here are simply the facts, and the facts reveal one (small sample) common denominator and one interesting and consistent ripple effect.
US dollar performance
The chart below plots the US dollar against the percentage difference between the US dollar and its 200-day simple moving average (SMA). The lower graph only shows positive values to filter out some noise. 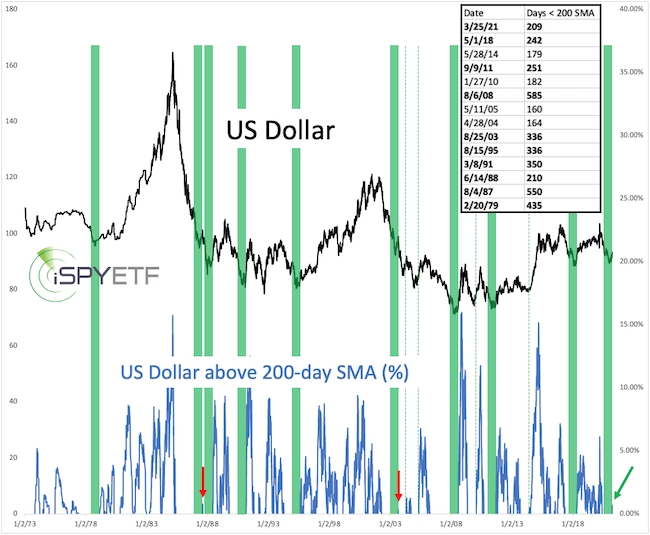
On Mar. 25, 2021, the USD closed above the 200-day SMA for the first time in 209 days. Since 1970, the US dollar traded below its 200-day SMA for >200 days 9 other times.
Green bars highlight the last 200 days of each >200 day steak. We’ll call the first close above the 200-day SMA after >200 days the signal date (see chart insert).
The next chart shows US dollar forward returns after the signal date.
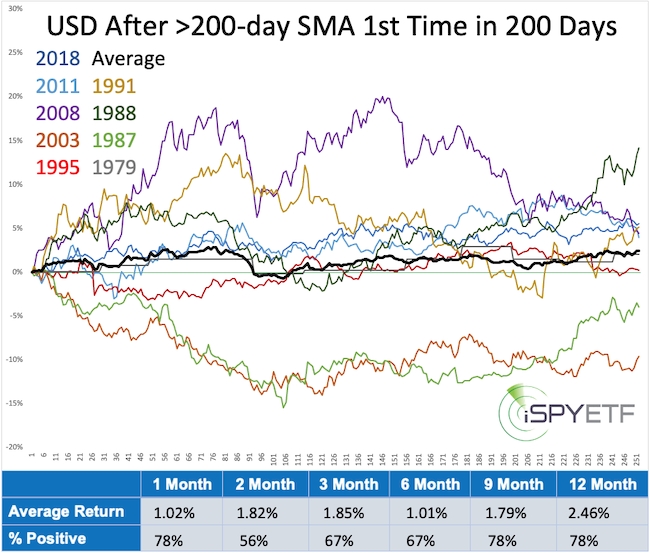
Returns were positive 7 of 9 times with 2 outright failures (1987 and 2003). The performance tracker at the bottom of the chart shows the average return after 1, 2, 3, 6, 9, and 12 months along with the percentage of positive returns.
In 1987 and 2003, when the US dollar fell back below the 200-day SMA (see second chart, red arrows), it persistently continued to drift lower.
ETFs linked to the US dollar include the Invesco DB US Dollar Index Bullish Fund (NYSE:UUP). One way to bet against the dollar is buying the euro via the Invesco CurrencyShares® Euro Currency Trust (NYSE:FXE).
S&P 500 performance
The next chart plots the performance of the US dollar against the S&P 500 and gold. Here are two things to keep in mind: 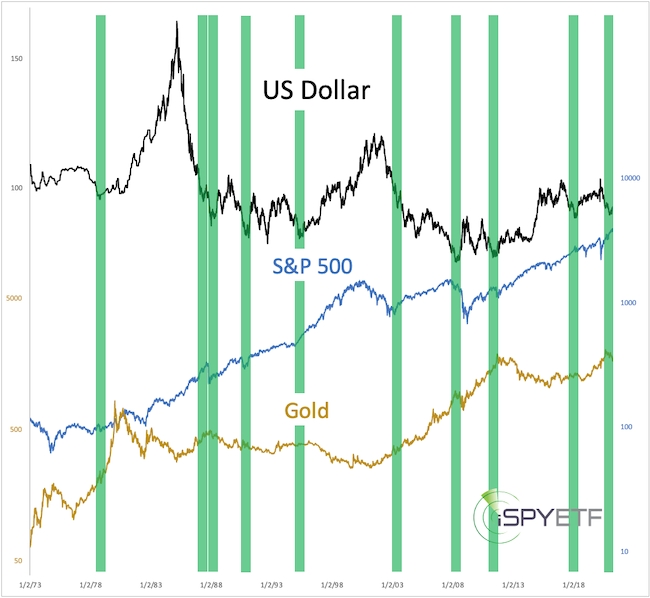
1. The chart captures 50 years of price action
2. The right side of the green bars marks the US dollar signal dates discussed above
As the performance tracker below shows, S&P 500 returns after the signal date were overall positive. 
The US dollar failure dates of 1987 and 2003 had no consistent impact as the S&P 500 tumbled more than 30% following the 1987 signal date, but rose as much as 16% after the 2003 signal date.
ETFs linked to the S&P 500 include the SPDR S&P 500 ETF (NYSE:SPY), iShares Core S&P 500 ETF (NYSE:IVV), and Vanguard S&P 500 ETF (NYSE:VOO).
Gold performance
Gold’s performance for the first 1-3 month following the signal date was dismal. Longer-term performance (6-12 months) was still weak, but in 1979 gold soared as much as 238%
The performance tracker below includes forward returns for all signal dates and forward returns ex 1979. 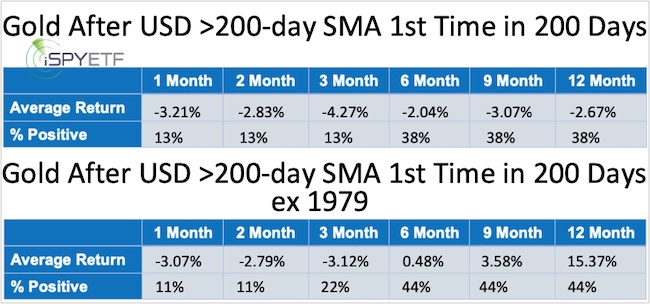
The US dollar failure dates of 1987 and 2003 had no consistent impact on gold. 1987 was a tough year for gold, down as much as 12%, but 2003 was a good year, up as much as 18%.
ETFs linked to gold include the SPDR Gold Shares (NYSE:GLD). ProShares UltraShort Gold (NYSE:GLL) is a leveraged inverse ETF which benefits from falling gold prices.
Summary
Climbing back above the 200-day SMA after at least 200 days below has been a positive for the US dollar. Even though the US dollar is back below the 200-day SMA—as in 1987 and 2003—I don't expected continued weakness for the coming year. However, a move back above the 200-day SMA is needed to neutralize a 1987 and 2003 repeat.
In general, the US dollar signal was positive for the S&P 500 and negative for gold although the failure dates of 1987 and 2003 had no consistent affect an either stocks or gold.
Based on this historic analysis, selling gold rallies and buying S&P 500 pullbacks have the best odds of positive returns.
