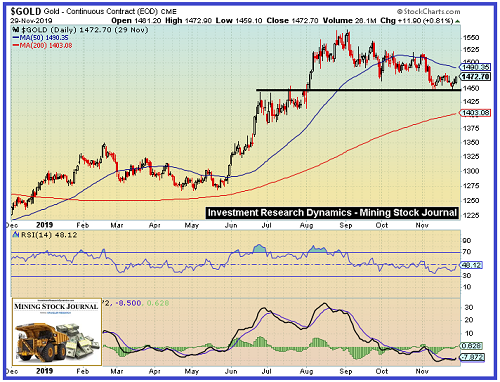
The price of gold has held firm at the $1460 (front-month contract basis, not the Kitco “spot” price) level despite the constant price attacks that have been occurring overnight and into the Comex floor trading hours since early November.

On an intra-day basis gold has managed to hold continuous aggressive attempts to push the price below $1460 for the last 6 trading days, including today. Interestingly, last Tuesday (November 26) and Friday, gold shot up during the Comex floor trading hours in the absence of any news or event triggers.
Zerohedge attributed Tuesday’s spike in gold to the jump offshore yuan vs the dollar. But that day gold started moving before the yuan moved. On Friday, gold soared as much as $14 from an intra-day low of $1459 while offshore yuan declined vs the dollar. Zerohedge’s explanation for the mysterious movement in the gold price on two days thus lacks evidence.
The open interest in the December Comex contract remained stubbornly high through first notice day last Friday. The banks, which have an extreme net short position in Comex gold have exerted an enormous effort to force hedge funds either to liquidate long positions or to sell December contracts and move out to February, which is the next “front month” contract.
If an unusually large number of longs decide to stand for delivery, it would place an enormous amount of stress on the warehouse stock of gold that has been designated as available for delivery in Comex vaults. In addition, India has been importing an enormous amount of gold starting in late October. This has provided strong price support from the physical market.
Also, the gold price has withstood a 43,000 contract liquidation in Comex open interest, including a 1-day record 127k contract liquidation in the December contract, much of which “rolled” out to February. Historically a drawdown in Comex open interest of this magnitude would have removed at least $50 from the gold price.
In the chart above, gold appears to be establishing a strong base in the $1460 area. The MACD shows an extremely oversold technical condition as does the RSI. With the Central Banks, including the Fed, printing money at a furious pace right now, the conditions are in place for potentially a big move in gold.
The commentary above is a partial excerpt from my latest issue of the Mining Stock Journal. In this issue, I present an opinion on the Kirkland Lake (NYSE:KL) acquisition of Detour Gold that may surprise some mining stock investors. The junior exploration stocks have been relentlessly pounded lower during this latest sell-off in the sector, especially relative to the shares of the mid-cap and large-cap producing miners. I believe several junior exploration stocks are trading at a price level which significantly reduces the risk and increases the potential ROR in these shares.
