STOCKS:
The European debt contagion has been “kicked down the road” a bit further as Spanish and Italian short-and-long term bond yields have moderated recently given the ECB “plan” to buy bonds of up to 3-years in maturity...but only if asked; and only if conditionality is imposed upon those asking. The Fed has also changed its game from “inflation-fighting” to “unemployment fighting”; and with any war — they will go further and farther than anyone believes in printing money to achieve their ends. This will support all asset prices ultimately.
STRATEGY: The S&P 500 remains above long-term support at the 160- wma at 1228; which delineates bull/bear markets. The much followed 200-dma support level stands at 1353, and remains the bulls “Maginot Line.” We’ve noted this is perhaps one of the “weirdest rallies” we’ve ever seen, and it causes us a great deal of consternation. But the new Fed policy is directly at stocks; expect an S&P all-time high test at 1576.
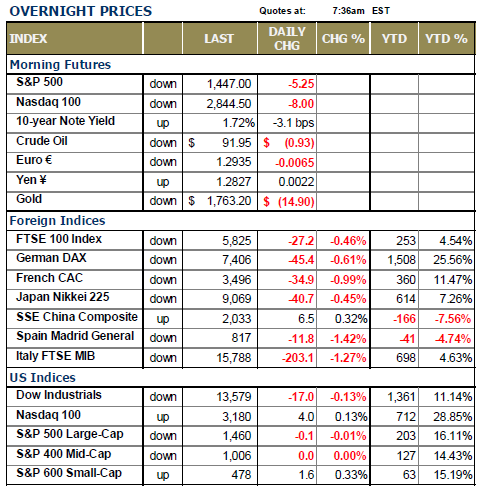
WORLD MARKETS ARE CORRECTING THEIR RECENT GAINS THIS MORNING as there are some concerns that the Spanish are once again, for the umpteenth time – dragging their feet on requesting a bailout. If there is anything we can count on is that once southern European bond yields move lower on the prospects of ECB intervention, then the governments’ propensity to fix their problems falls with yields. Such is the case today; and there are reports out of Germany that they are growing weary of the Spanish intransigence to make the long-awaited request. German Finance Minister Schaeuble has even gone as far to say that Spain doesn’t need a bailout to take pressure of the situation…or to backhandedly push Spanish yields higher to pressure Spain. But this is Politics 101; and this is how they play out. What we find interesting that is that Spanish yields aren’t moving higher this morning.
In terms of the current state of the stock markets, they are still consolidating the gains seen prior to the Fed’s “game changer” 10-days ago; and we still see them going higher in the very short-term. We view the current consolidation in the S&P 500 as very similar to that seen prior to the Fed’s announcement; and look for higher prices towards the all-time highs at 1550-to-1600. Now, we won’t say this rally will be dressed up and really pretty, for we believe it shall be rather ugly and scraggly – and once it arrives at the “dance zone”, then we’ll see a rather material correction as that is nearly always the case on the first attempt to poke to
new highs.
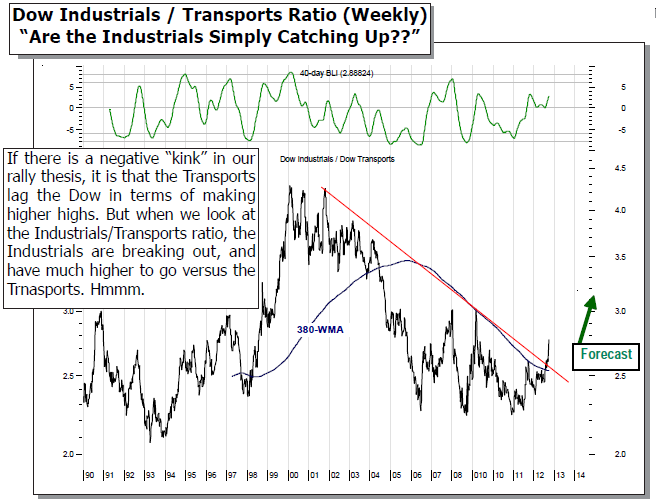
At present, our worst worry is the Dow Transports, for they made their highs in July-2012 and have since traded lowerto- sideways as the Dow Industrials have enjoyed a rather healthy rally. Many will point to this as a “non-confirmation” of Dow Theory, and we’ll leave the particulars of this theory to others more versed in this controversial area. Let us further note that this used to be the simplest of indicators; elegant in its simplicity as one only had to view highs and lows and one could get a sense of confidence in a rally and consequently the economy. This is no longer the case a myriad of technicians have found many holes in the theory, and there is a raging debate going on as to its current validity. We like to keep things simple here; we are concerned that the Transports have not forged a high with the Industrials “yet.”
But to this end we’ve provided a ratio chart of the Dow Industrials/Dow Transports. It is quite clear to us that the Industrials are breaking out against the Transports above the 300-week moving average for the first time since 1998 – just as the Fed was once again easing monetary policy aggressively in lieu of the Russian Credit Crisis. So, it would appear that a new trend towards higher Industrial prices versus Transports has taken place. We should further note the Industrials hit their absolute peak in 1999, while the ratio continued higher into March-2000 highs.
TRADING STRATEGY: At present, we are positioned bullishly, with an emphasis upon “reflation” given the Fed’s balance sheet is larger than our margin account to bet against it. If we are looking to be long again, we’ll look towards two energy plays: Weatherford (WFT) and Transocean (RIG). On Friday, both these stocks were “higher” on rather impressive displays of strength in a stagnant market – perhaps the late cycle energy plays are the place to be. WFT forged a key reversal higher; while RIG was sharply higher on 4x its normal volume, and on the cusp of a major breakout above its 280-day moving average. We like these patterns a great deal.
To Read the Entire Report Please Click on the pdf File Below.
