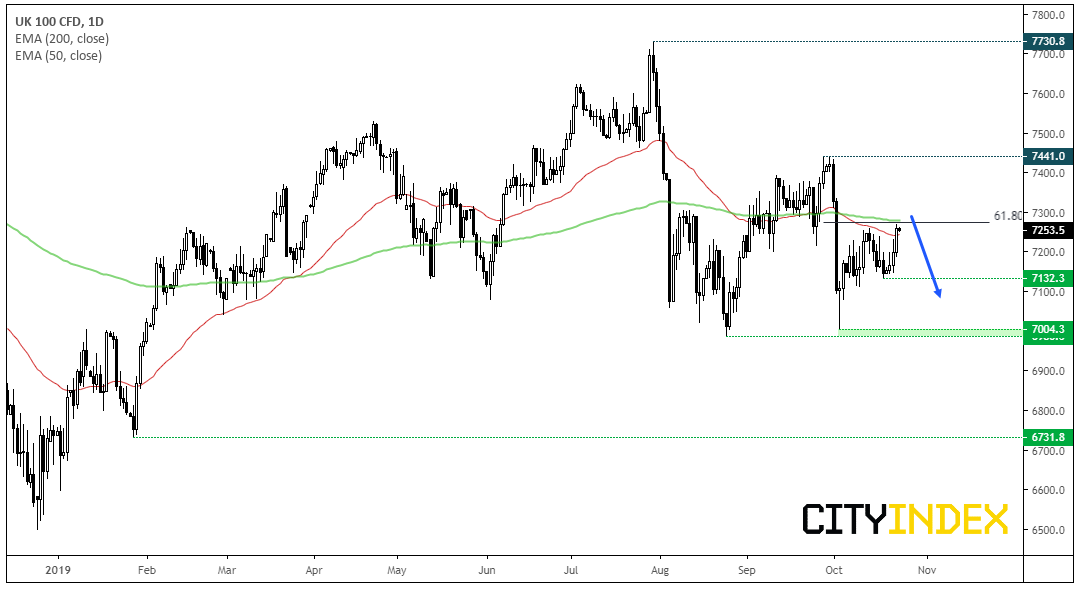
The FTSE 100 continues to chop its way around between key levels, yet with resistance nearby, upside could now be limited.
The recovery frim 7000 has so far come in 3 waves. As momentum from the lows pales in comparison to the decline from 7441 to 7000 the rebound still looks corrective. Furthermore, yesterday’s high is now trading just below the 200-day eMA (and between the 50-200 eMA zone) and stopped just shy of the 61.8% Fibonacci retracement level. Therefor upside could be limited unless we see a global rebound across equities. For now, bears could look to fade into areas of weakness and seek signs of a top. After which the 7132 and 7000 lows come into focus for the bear-camp.

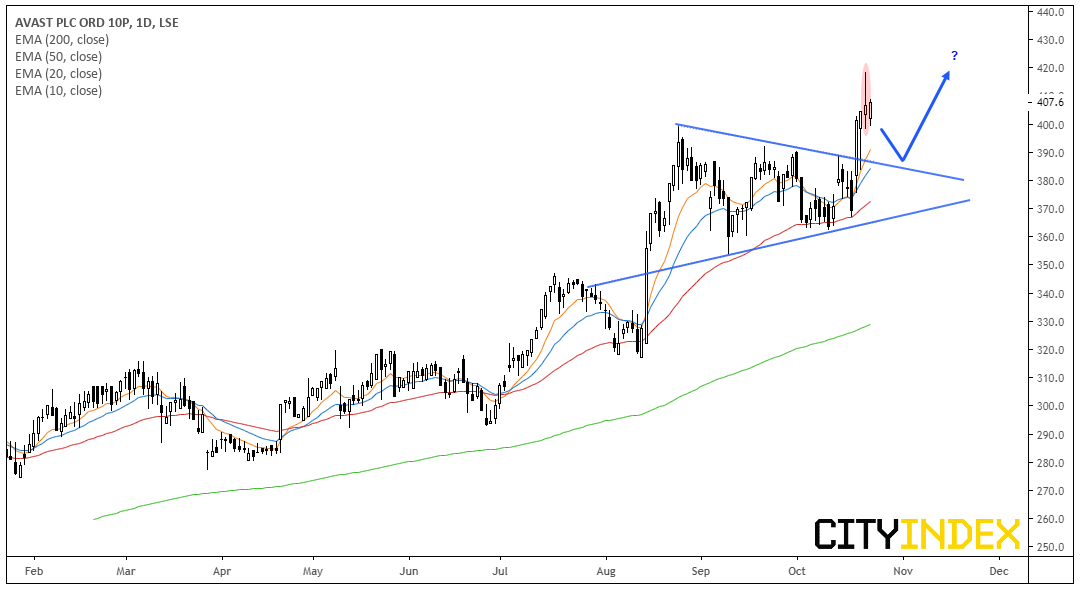
Avast PLC (LON:AVST): Trading just off its record high after breaking out of a symmetrical triangle, we’re waiting for price to consolidate or pull back for a better entry. Up 43.5% YTD, the software and security company has outperformed the FTSE 350 this year, it looks like momentum is just ramping up. However, given the bearish hammer and extended distance from the eMA’s, we’d prefer to see a higher low form before assuming new highs and trend continuation.

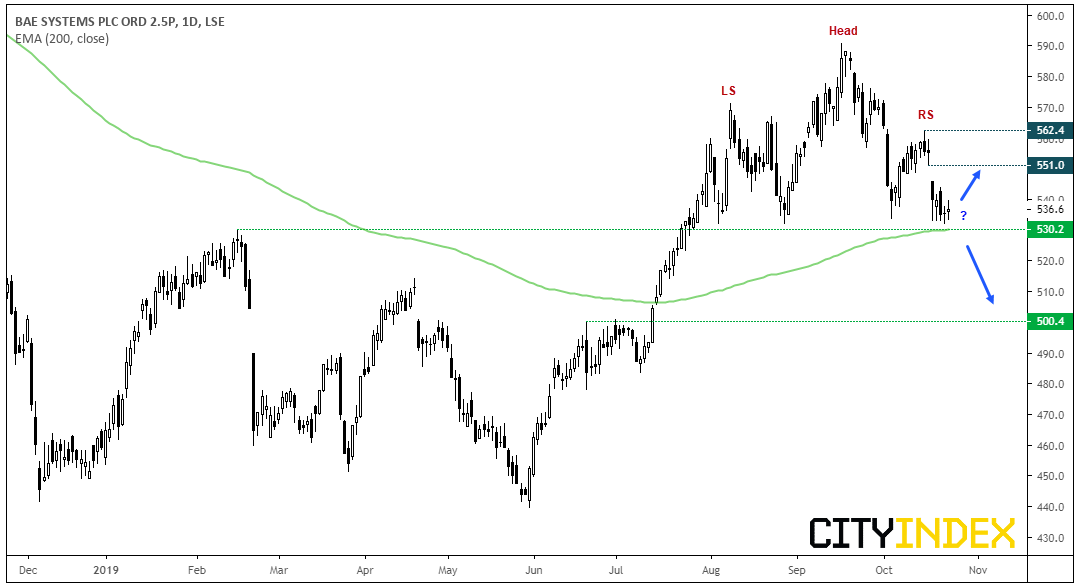
BAE Systems PLC (LON:BAES): A potential head and shoulders top is forming, although it’s neckline is just above the 200-day eMA and 530 support. Whilst this means support around 530 could be a tougher nut to crack, it becomes more significant if it does break, or could still provide a bullish setup over the near-term if it bounces instead. Bears could wait for a break below 530 to assume the H&S has been confirmed and target 500, whereas bulls could target the upper gap around 550.

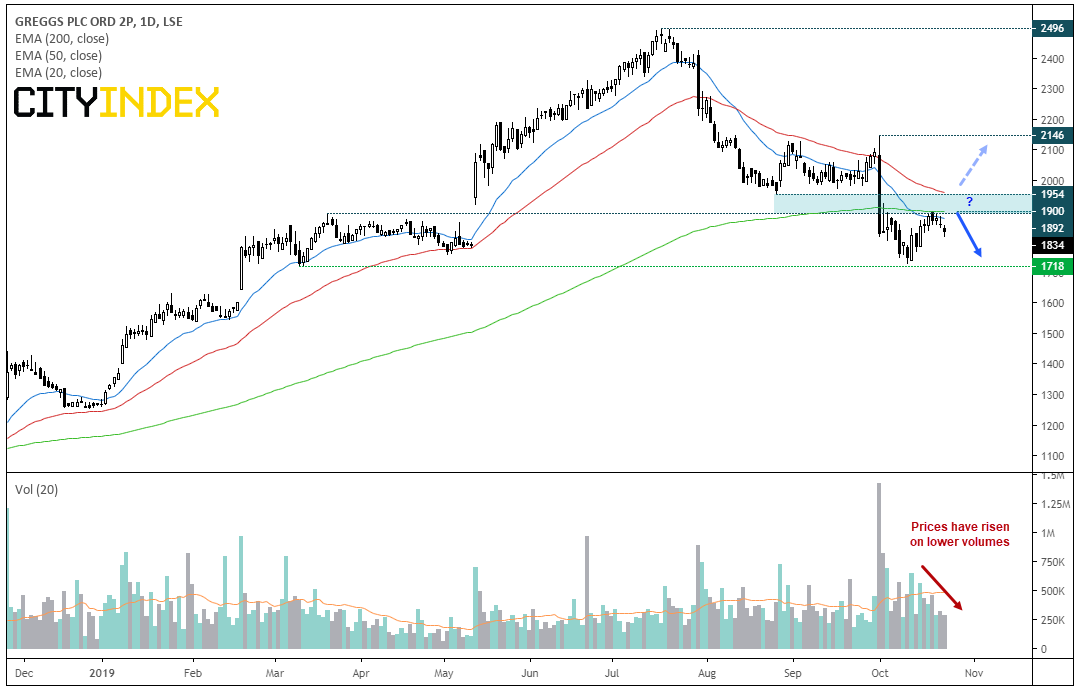
Greggs PLC (LON:GRG): In some ways, Greggs is similar to the setup on Starbucks (NASDAQ:SBUX) we highlighted earlier this week. It’s recently broken beneath the 200-day eMA and bounced back towards this level. Indeed, bearish swing traders could look for a move towards the 1718 low whilst prices hold beneath the 1900 area. Also note that the 20 and 50-day eMA’s could cap as dynamic resistance and that the recent ‘rebound’ has been seen in lower volume (meaning it’s more likely corrective). A break below 1718 assumes a run towards 1500.
Bulls may point towards a potential inverted H&S, although we’d want to see prices back above 1954 before assuming the corrective low from the 2496 high is in.
Cranswick PLC (LON:CWK): Since breakout out from its 12-month basing pattern, the breakout climbed to a 12-month high. Yet momentum has clearly turned so this on now on the backburner, although we’ll monitor to see if it can build a new level of support above 3116 (breakout level) before reconsidering longs, to target the 3500 high.
ConvaTec Group PLC (LON:CTEC): The break above 188 failed to hold up and by the close produced a key reversal day, back below resistance. This is on the back burner for now but, given its create support around 180 (potential higher low) then we’d reconsider if it were to break back above 191.15
Imperial Brands PLC (LON:IMB): It remains on the watchlist as it’s consolidating after a fall to a new cycle low. Traders could look for a break of 1800 to assume bearish trend continuation. The 1736.2 low is the initial target, although given the strength of the bear trend overall, an eventual break low remains the bias. Alternatively, traders could fade into moves below the 1929.2 gap high – above here bulls would likely look to close the gap up to the 2000 area.
JD Sports Fashion PLC (LON:JD): Trading just off its record highs in a tight flag pattern and found support at its 10-day eMA. It’s one of the stronger performers this year in the FTSE, and daily trend remains bullish above 717.
Segro PLC (LON:SGRO): It hit an 11-year high on Tuesday but, if you’re not in, may be time to wait for a retracement given the shooting star on the daily chart. A bullish engulfing candle marks a higher low at 804.6, so we’d like to see a new level of support build above the 800-804 region before reconsidering longs.
AVEVA Group PLC (LON:AVV): After finally breaking out of its corrective (bearish) channel, prices charged for 4,000 on Tuesday. However, a bearish hammer with a wide body warns of the need for a retracement, so now look for either 3800 to hold as support, or somewhere around a new bullish trendline projected from the September low. Given the longer-term bull trend, it remains firmly on our bullish watchlist.
