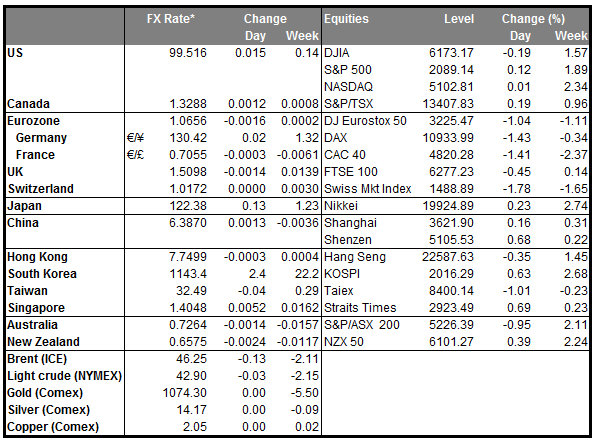
• Fed minutes: For some members the hike was a “close call” Fed officials decided unanimously to raise interest rates in December after almost a decade, but the minutes of the meeting revealed that for some officials the decision to hike was a close call. The concerns arose from the low inflation that needs to be closely monitored. The debate over the outlook for inflation will be crucial to determine the future path of rate increases. Fed officials’ generally expect four more rate hikes this year, compared to current market expectations of two. Officials in recent days have emphasized they could lift interest rates four times this year, despite the stock market decline in the early days of the year. If the inflation data going forwards begin to improve, the market will have to re-price the number of rates hikes, which leaves room for the dollar to appreciate further. Still, FOMC members pointed to factors that could throw their inflation outlook off course. Further declines in oil and other commodity prices as well as the strong dollar, impose important downside risks to the inflation outlook.
• Overall, the message from the minutes was that if the economy disappoints, the Fed could hold off on rate increases. Likewise, it could accelerate the pace of hikes if the economy surprises with a rise in inflation and strong growth. The dollar remains data-driven and positive US data are needed to keep it in a bullish trend.
• Chinese stock markets stopped trading about 30 min after opening Even though China’s stock market regulators announced new rules to restrict major shareholders of listed companies to sell their shares, this was not enough to stabilize the markets. Chinese stock markets plunged more than 7%, triggering an automatic halt to trading for the 2nd time in 4 days. Spillover effects into other equity markets are likely, which could see funding currencies such as JPY, EUR and CHF outpacing their counterparts.
• Today’s highlights: Eurozone’s retail sales for December, a closely watched measure of household confidence, are forecast to have rebounded on a monthly basis after falling for the previous two months. The expected rise in the figure is likely to be due to seasonal factors as a result of increased shopping during the holidays. The bloc’s unemployment rate for the same month is forecast to have remained unchanged at 10.7%. Final consumer confidence for December is expected to confirm its preliminary reading, though this indicator is usually not a major market mover. Net-net, the market may pay more attention to retail sales, which could prove EUR-positive, at least at the release.
• From the US, initial jobless claims for the week ended on the 1st of January, are forecast to have decreased from the previous week. Even though this indicator is usually not a major market mover, just one day ahead of the US employment report for December, it may attract more attention than usual, especially following the solid ADP employment report on Wednesday. This could support the dollar further.
• The Canadian Ivey PMI for November is also due to be released, but no forecast is available. Given that the RBC manufacturing PMI for the same month declined, we see a strong possibility for the Ivey index to follow suit, which could weaken CAD a bit, at least temporarily.
• We have three speakers scheduled on Thursday’s agenda: Bank of Canada Governor Stephen Poloz, Richmond Fed President Jeffrey Lacker and Chicago Fed President Charles Evans speak.
The Market
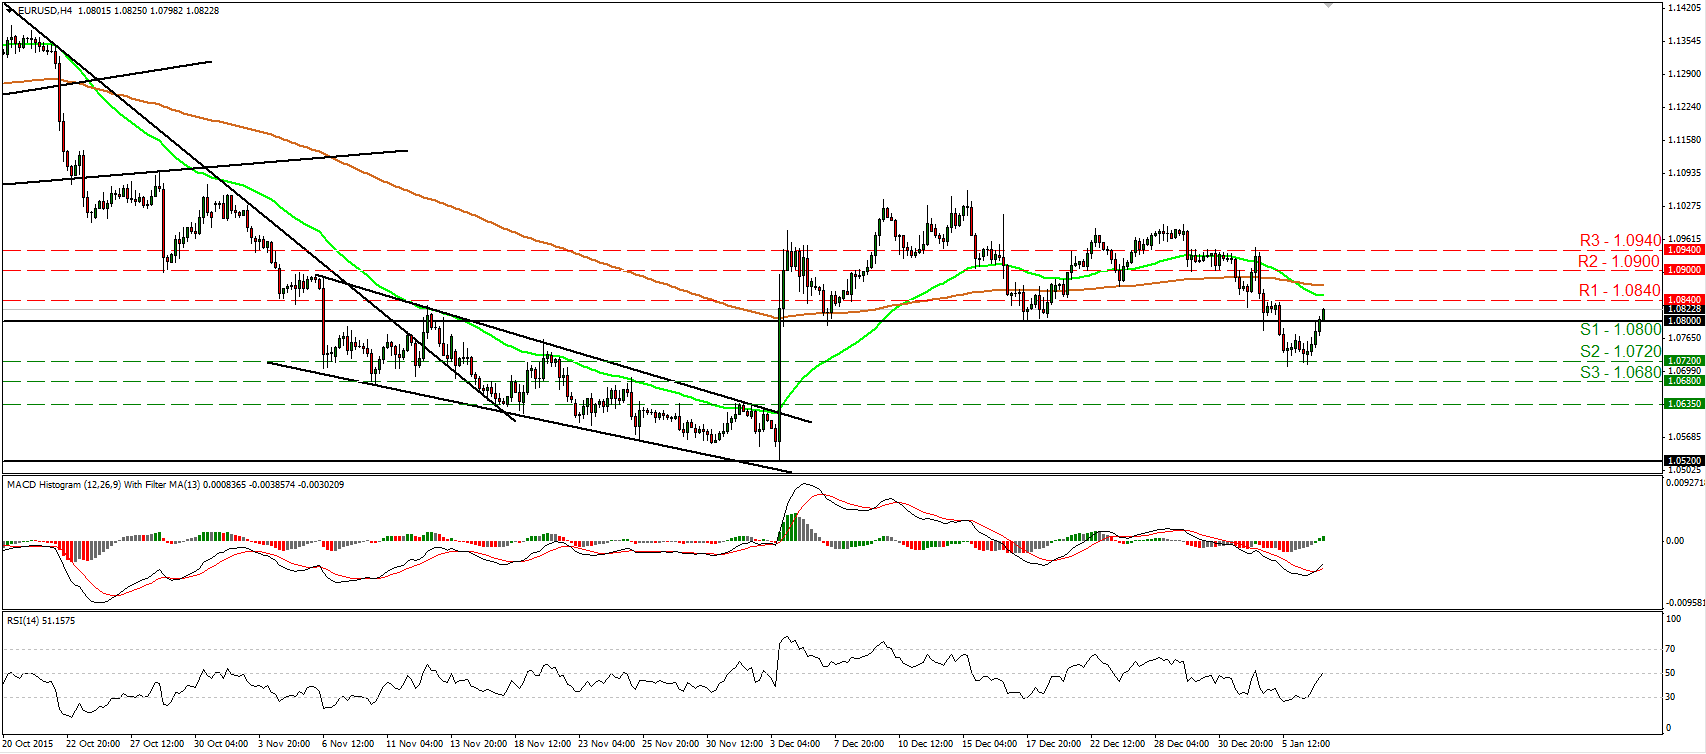
EUR/USD rebounds back above 1.0800
• EUR/USD traded higher yesterday as the Fed meeting minutes reminded investors that officials plan to normalize policy gradually. The rate edged north after it hit support at 1.0720 (S2) and managed to emerge back above the 1.0800 (S1) key hurdle. The short-term trend still looks somewhat negative but bearing in mind the move above 1.0800 (S1) and taking a look at our short-term oscillators, I would switch my stance to neutral for now. The RSI moved higher after it hit support near its 30 line. It is now testing its 50 line and could move above it soon. The MACD, although negative, has bottomed and crossed above its trigger line. These technical indicators support that the rebound may continue for a while. Switching to the daily chart, I see that on the 7th and 17th of December, the rate rebounded from the 1.0800 (S1) key hurdle, which is also the lower bound of the range the pair had been trading from the last days of April until the 6th of November. Therefore, yesterday’s move back above that hurdle makes me stay flat as far as the medium-term picture is concerned as well.
• Support: 1.0800 (S1), 1.0720 (S2), 1.0680 (S3)
• Resistance: 1.0840 (R1), 1.0900 (R2), 1.0940 (R3)
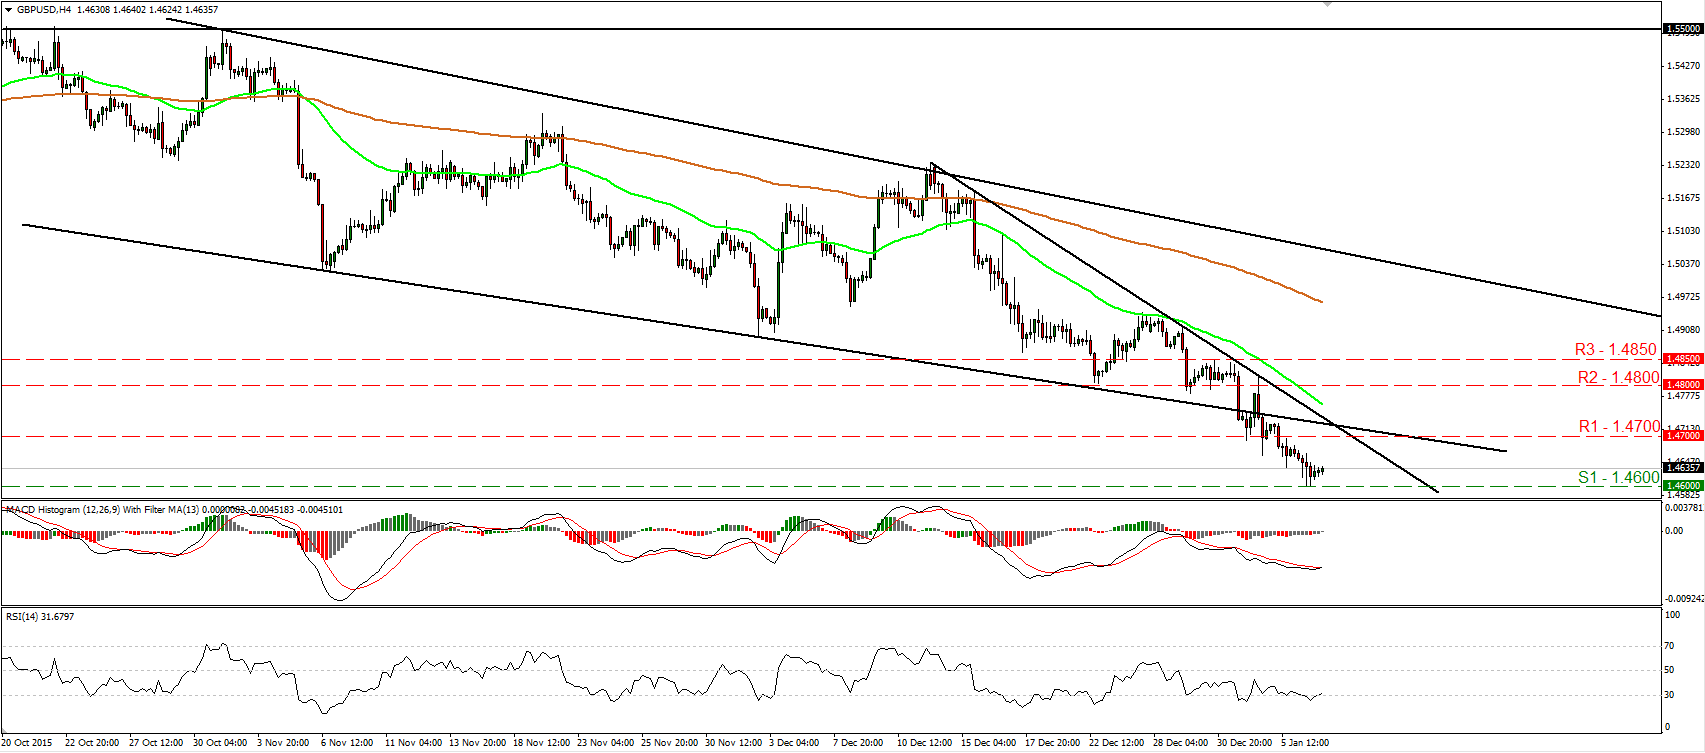
GBP/USD hits support at 46.00
• GBP/USD continued trading lower, falling below the downside support line taken from the low of the 6th of November and below the support (turned into resistance) obstacle of 1.4700 (R1). Although the short-term trend remains cautiously negative, bearing in mind our momentum studies, I believe that we are likely to experience an upside corrective move for now, perhaps to test the 1.4700 (R1) barrier as a resistance this time. The RSI rebounded from slightly below its 30 line, while the MACD, although negative, has bottomed and poked its nose above its trigger line. In the bigger picture, the price structure remains lower peaks and lower troughs below the 80-day exponential moving average, which is pointing down. Thus, I still see a negative longer-term picture. Nevertheless, I would get more confident on that down path if I see a clear close below the 1.4600 (S1) zone, which acted as a strong support territory back in mid-April.
• Support: 1.4600 (S1), 1.4560 (S2), 1.4500 (S3)
• Resistance: 1.4700 (R1), 1.4800 (R2), 1.4850 (R3)
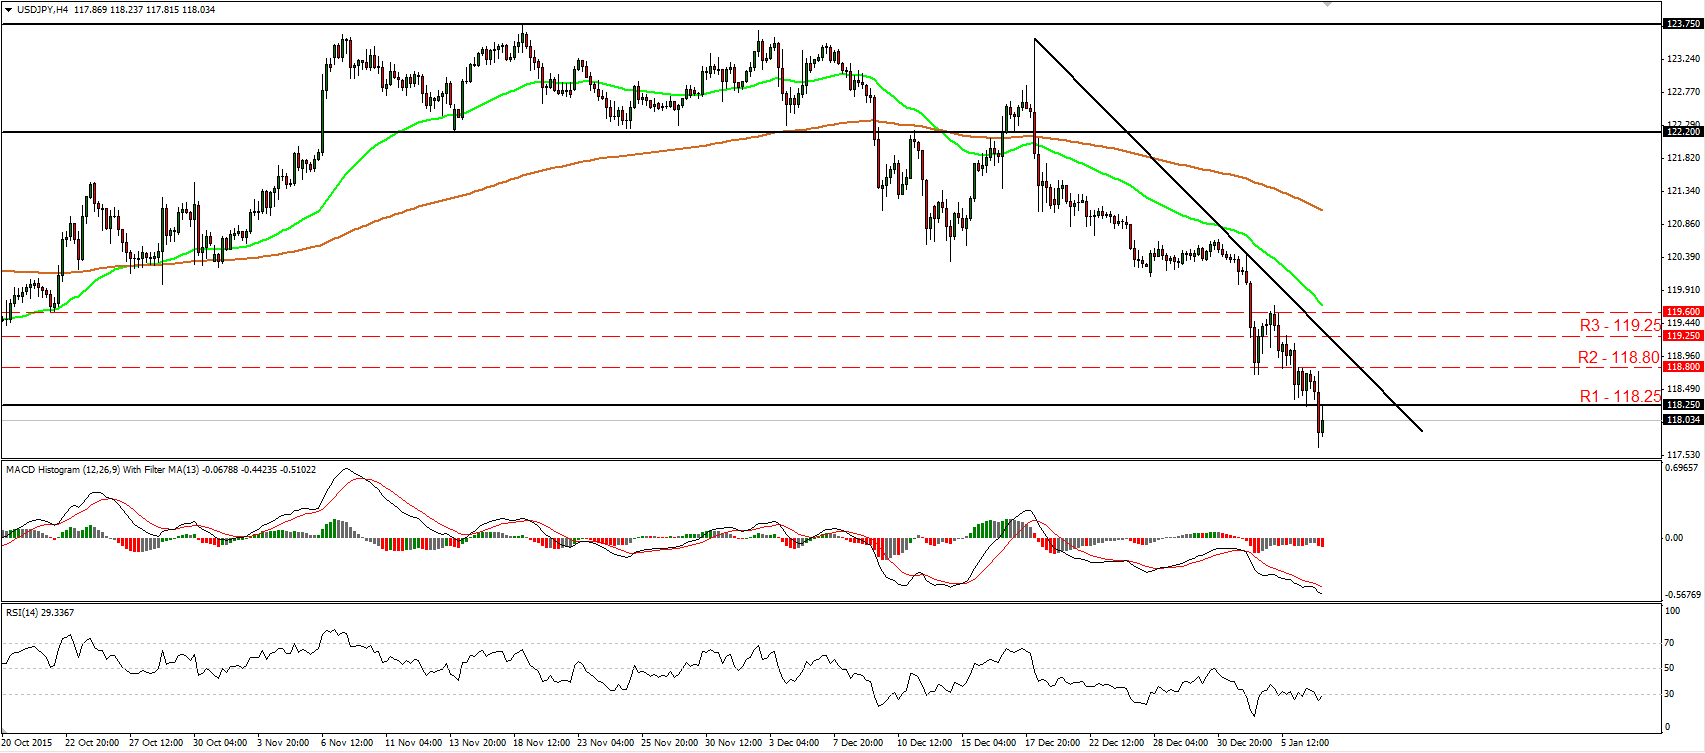
USD/JPY breaks below the key zone of 118.25
• USD/JPY continued its tumble on Wednesday, falling below the key support (now turned into resistance) zone of 118.25 (R1). The short-term outlook remains negative in my view and therefore, I would expect the bears to regain their momentum at some point and perhaps challenge the 116.90 (S1) support zone. However for now, our short-term oscillators give evidence that minor corrective bounce could be on the cards before the next bearish leg, perhaps even back above 118.25 (R1). The RSI looks able to move above its 30 line, while the MACD, although at extreme negative levels shows signs that it could start bottoming. As for the broader trend, the break below 118.25 (R1) raises some concerns for a major trend reversal. If the rate manages to close the day below that zone, this could increase the possibilities for a long-term reversal.
• Support: 116.90 (S1), 116.00 (S2), 115.50 (S3)
• Resistance: 118.25 (R1), 118.80 (R2), 119.25 (R3)
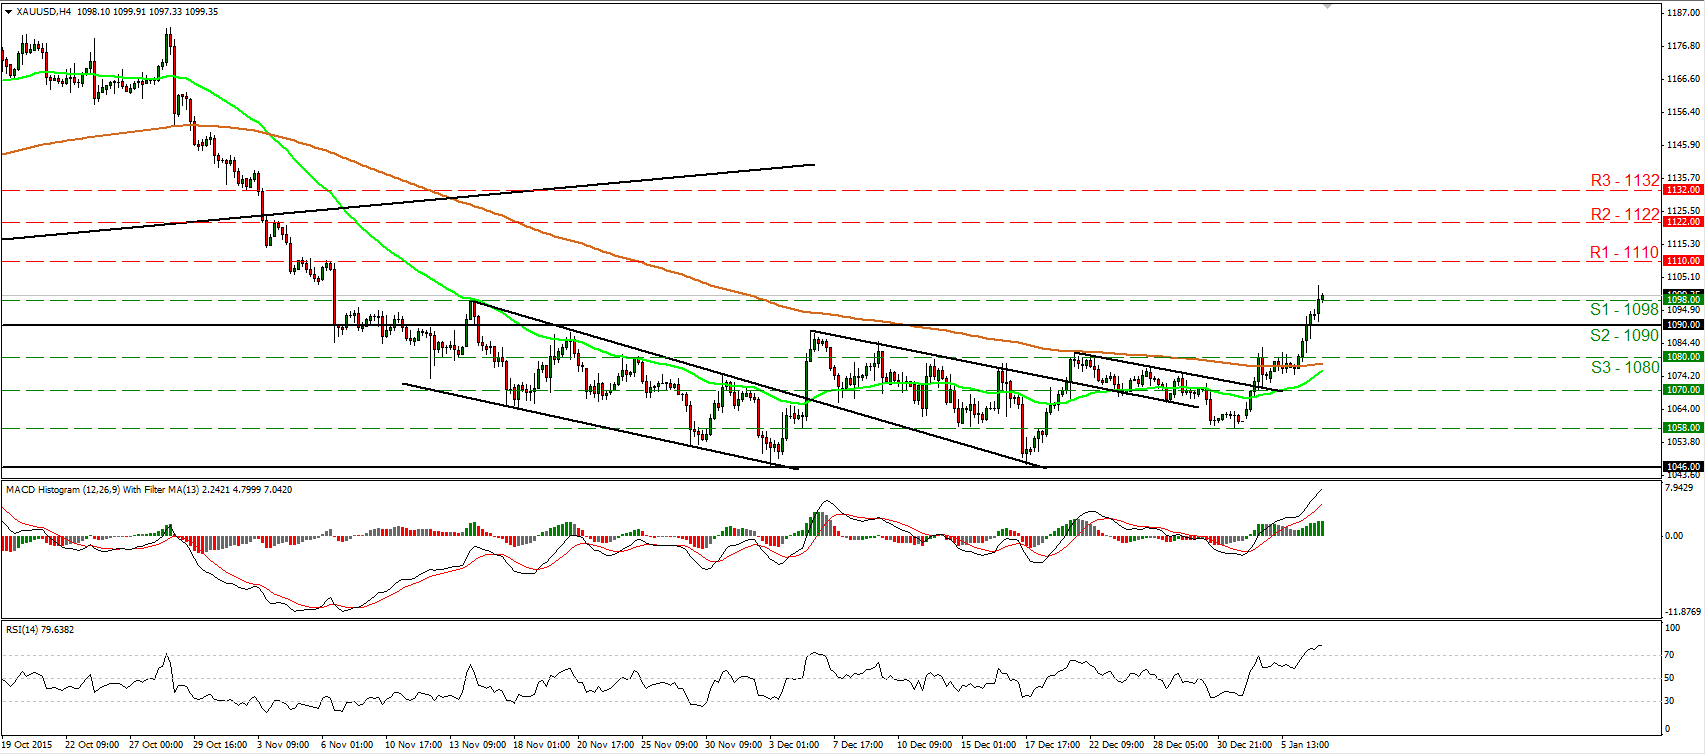
Gold trades in a consolidative manner
• Gold traded higher yesterday, breaking above three resistance (now turned into support) barriers in a row. The price structure on the 4-hour chart now suggests a short-term uptrend and as a result, I would expect the break above 1098 (S1) to initially aim for the 1110 (R1) zone, marked by the peaks of the 5th and 6th of November. Our short-term oscillators detect accelerating upside speed and corroborate my view that the metal could continue higher for a while. The RSI moved above its 70 barrier and is pointing up, while the MACD, at extreme positive levels, stands above its trigger line and points north as well. As for the broader trend, the move above 1090 (S2) signaled the upside exit of the sideways range the precious metal had been trading between that zone and the support area of 1046. Therefore. I believe that medium-term picture has turned somewhat positive as well.
• Support: 1098 (S1), 1090 (S2), 1080 (S3)
• Resistance: 1110 (R1), 1122 (R2), 1132 (R3)
DAX futures rebound from above 10200
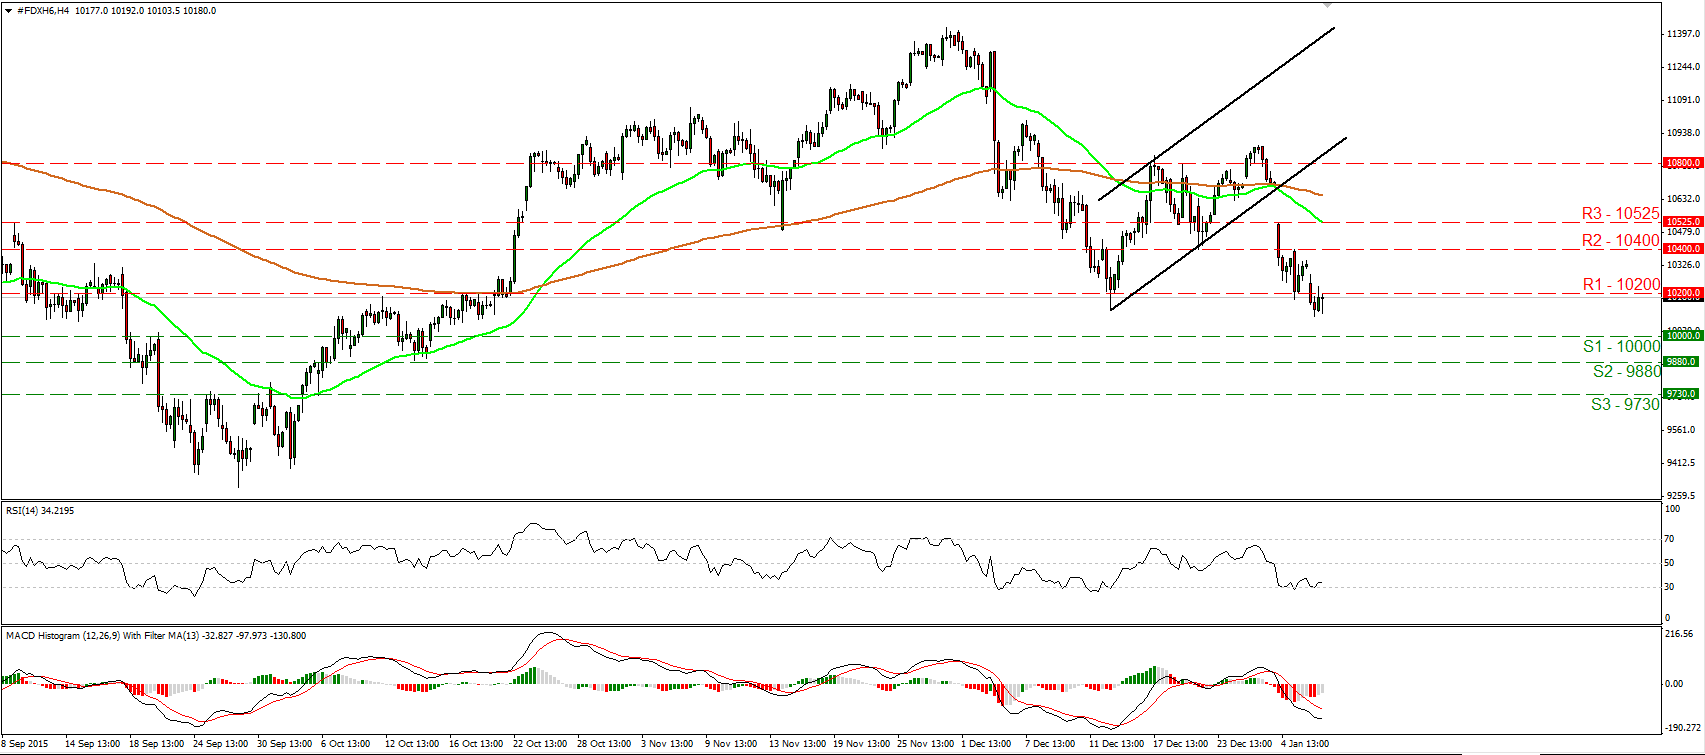
• DAX futures continued trading lower yesterday, falling below the key support (now turned into resistance) zone of 10200 (R1). However, the decline fell short of reaching the psychological zone of 10000 (S1) and rebounded somewhat. The short-term outlook remains negative in my view and I would expect the bears to challenge 10000 (S1) any time soon. Nevertheless, taking a look at our near-term momentum studies, I see that the RSI rebounded from its 30 line, while the MACD, although negative, shows signs of bottoming. These signs amplify the case that a minor corrective bounce could be looming before the next negative leg. As for the broader trend, the price structure on the daily chart points to a downtrend as well. Moreover, the close below 10200 increases the possibilities for larger negative extensions.
• Support: 10000 (S1), 9880 (S2), 9730 (S3)
• Resistance: 10200 (R1), 10400 (R2), 10525 (R3)

