Risk sentiment rebounded again during the Asian morning Friday, due to reports pointing to much less cases and deaths for Thursday than Wednesday. In the FX world, the pound was the main winner among the G10 currencies, surging after UK PM Johnson replaced Finance Minister Sajid Javid, a move that raised hopes of a bigger fiscal package. T
he euro kept tumbling, taking once again the last place, on concerns over the Eurozone's economic performance.
Asian Equities Rebound on Virus Cases Slowdown
The dollar traded higher against the majority of the other G10 currencies on Thursday and during the Asian morning Friday. It gained versus EUR, SEK, NZD, CHF and slightly against CAD, while it was surrendered to GBP’s massive strength. Against AUD, JPY, and NOK, it was found virtually unchanged.
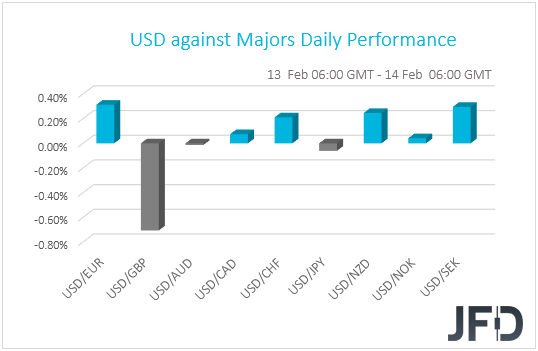
Once again, we can not derive safe conclusions with regards to the broader market sentiment by just looking at the performance of the G10 currencies and thus, we will turn our gaze to the equity world. There, most major EU and US indices traded in the red, with the concerns over the steep surge in virus cases and deaths reported yesterday rolling into those sessions as well.
That said, sentiment was once again reversed during the Asian morning today, with the majority of Asian bourses trading in green territory. Despite Japan’s Nikkei losing 0.59%, China’s Shanghai Composite and Hong Kong’s Hang Seng gained 0.38% and 0.25% respectively.
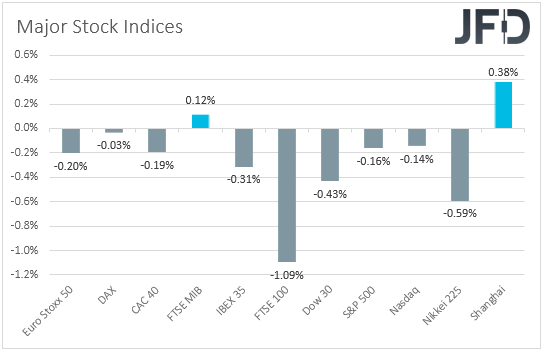
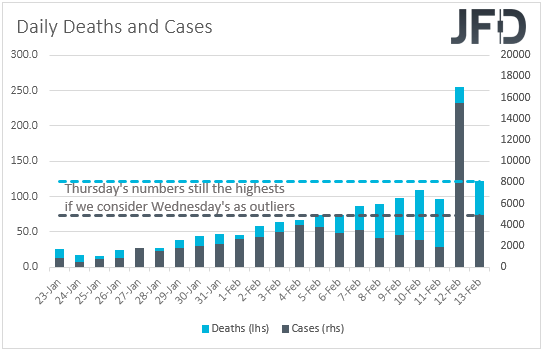
It seems that EU and US markets wait to get the signal from the Asian session on how they should perform. Yesterday, they slid on reports over a steep acceleration in coronavirus cases and deaths, while today, they may rebound for exactly the opposite reason. Today, there were officially reported 4919 cases and 122 deaths worldwide for Thursday, much less than Wednesday’s numbers.
Looking at the graphs I’ve been posting on a daily basis recently, we can see that we are back in slowdown mode. Remember that anything above zero shows acceleration, while negative readings point to slowdown.

As for our view, things have not become better and we don’t think that the impact on global economic growth will be less than what we believed yesterday. After all, following Wednesday’s surge due to a new method of identifying cases, a slowdown just the next day appears more than normal to us.
On top of that, if we treat Wednesday’s numbers as outliers, still Thursday’s are the largest daily counts since the outbreak of the virus. In other words, if it wasn’t for Wednesday’s surge, we would be in acceleration mode.
Thus, we stick to our guns that the worst is not behind us yet and we repeat that we will take things day by day. Although EU and US indices may follow the overnight rebound, we are still reluctant to trust a long-lasting recovery.
We believe that the effects may not be so temporary as many believe, and that further spreading may not impact only Q1 growth, but the economic wounds could well drag into Q2. Thus, anything suggesting that the virus is far from contained may serve another round of risk aversion with investors abandoning risk assets again and seeking shelter in safe havens.
US CPIs Beat Estimates, Pound Gains on Javid’s Resignation, EUR Stays in Free Fall Mode
Coming back to the currencies, the dollar may have remained relatively strong, despite the risk rebound overnight, perhaps due to the better than expected CPIs for January. The headline rate rose to +2.5% yoy from +2.3%, instead of ticking up to 2.4% as the forecast suggested, while the core one held steady at +2.3% yoy, beating estimates of a tick down to +2.2%.
That said, with the core rate staying unchanged, investors may have been worried that the core PCE yoy rate, which is the Fed’s favorite inflation metric, may held steady as well, at +1.6% yoy, well below the Bank’s objective of 2%. Thus, their expectations over a September rate cut have not changed.

The pound was yesterday’s big winner, fueled by news that UK PM Boris Johnson forced Finance Minister Sajid Javid to step down, after he refused to replace his special advisers. Johnson appointed Rishi Sunak as the new Finance Minister, a person very loyal to him.
Javid was not on the same page with Johnson’s policy adviser over spending plans, adopting a more cautious stance. Therefore, his replacement by Sunak sparked hopes of more fiscal support, something that may lessen the need for a rate cut by the BoE.
As for our view, the pound may continue marching higher due to expectations over a larger fiscal package, but we will not get overly excited over a long-term recovery. Let’s not forget that the UK is about to start negotiations with the EU over their future relationship, including trade, and with PM Johnson insisting that any accord should be found before December, the risk of a disorderly exit then remains well on the table. Thus, the pound may be set for a bumpy ride, with any talks revealing huge diversion in positions having the potential to keep a lid on any rallies, and even trigger decent slides.
For now, we prefer to exploit any potential pound gains against risk-linked currencies, like the Aussie and the Kiwi, which could well come under selling interest if news and headlines continue to point to a fast spreading of the coronavirus, the outbreak of which started in China, the main trading partner of both Australia and New Zealand.
Passing the ball to the euro, the common currency continued to slide, taking for another day the last place on the G10 performance table. As we noted yesterday, this may have been due to weak economic data coming out from the Eurozone, which may have raised concerns that the second estimate of Eurozone’s Q4 GDP, due out today, may be revised lower, from a modest 0.1% qoq growth to stagnation.
If indeed this is the case, the currency’s tumble is likely to accelerate, and if risk appetite takes another hit in the following days, we expect the biggest declines to be against the safe havens. The dollar may be the best choice as it’s been also supported by decent economic data, like last Friday’s better than expected employment report. After the dip below last year’s low, EUR/USD is now trading in waters last seen in April 2017. Between the franc and the yen, we would choose the yen, as we are reluctant to call for further declines in EUR/CHF, as the SNB may decide to intervene into that exchange rate at any given time.
GBP/AUD – Technical Outlook
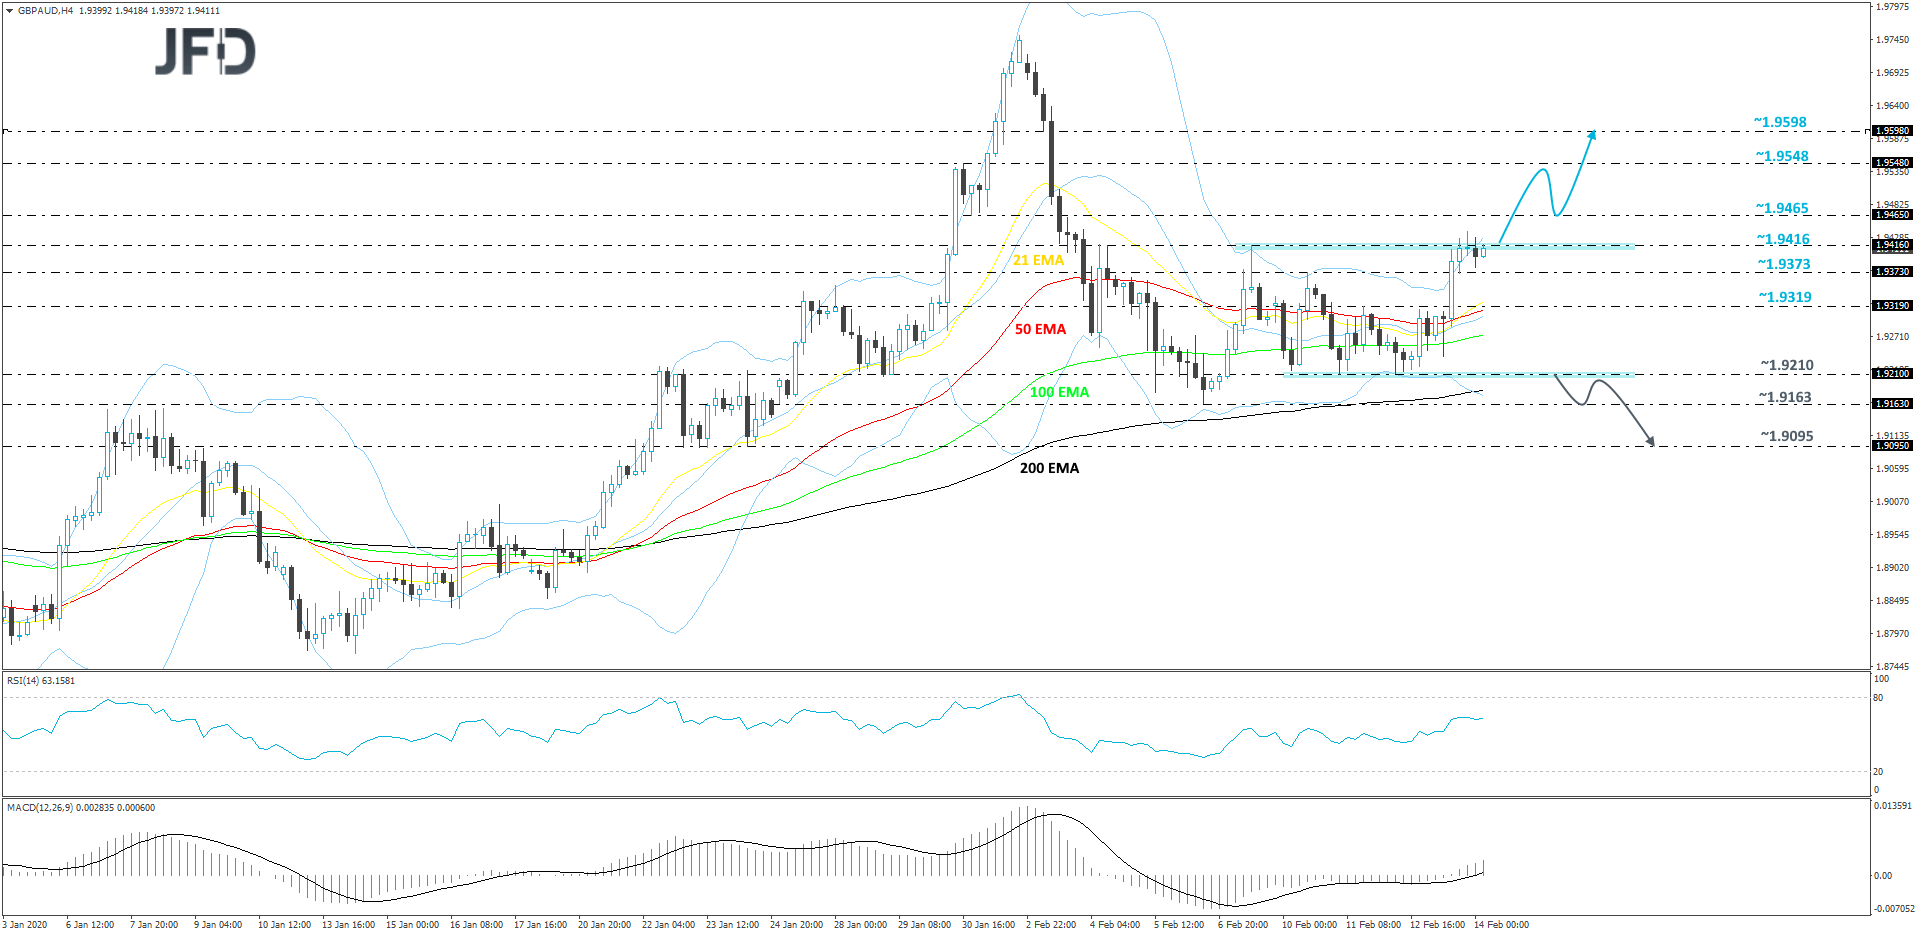
This morning, GBP/AUD is already knocking on the door of the upper side of its short-term range, which has been in play from the beginning of February. That range is roughly between the 1.9210 and 1.9416 levels. Although we are seeing random overshoots above the upper bound, still, the bears keep pushing the rate back into the range. In order to get comfortable with higher areas, we will wait for a strong push above that area, hence why we will stay neutral for now.
Eventually, if the bulls give a good boost to the pair and push it well above the 1.9416 territory, this may attract more buyers into the game and the rate could get lifted to the 1.9465 zone, which is an intraday swing low of January 30th. If that area is just seen as a temporary obstacle, GBP/AUD could end up traveling to the 1.9548 hurdle, which is the high of January 30th. The rate might stall there, or even correct back down a bit. That said, if it continues to balance above the 1.9416 zone, we will continue aiming higher. If this time the bulls are able to lift the pair above the 1.9548 barrier, that could lead it to the 1.9598 level, marked by an intraday swing low of February 3rd.
In order to start examining the downside, we will wait for a break of the lower side of the aforementioned range, at 1.9210. This way, the pair could come under more selling pressure, as the break would confirm a forthcoming lower low. That’s when we will target the 1.9163 obstacle, which if broken might set the stage for a move to the 1.9095 level, marked near the lows of January 23rd and 24th.
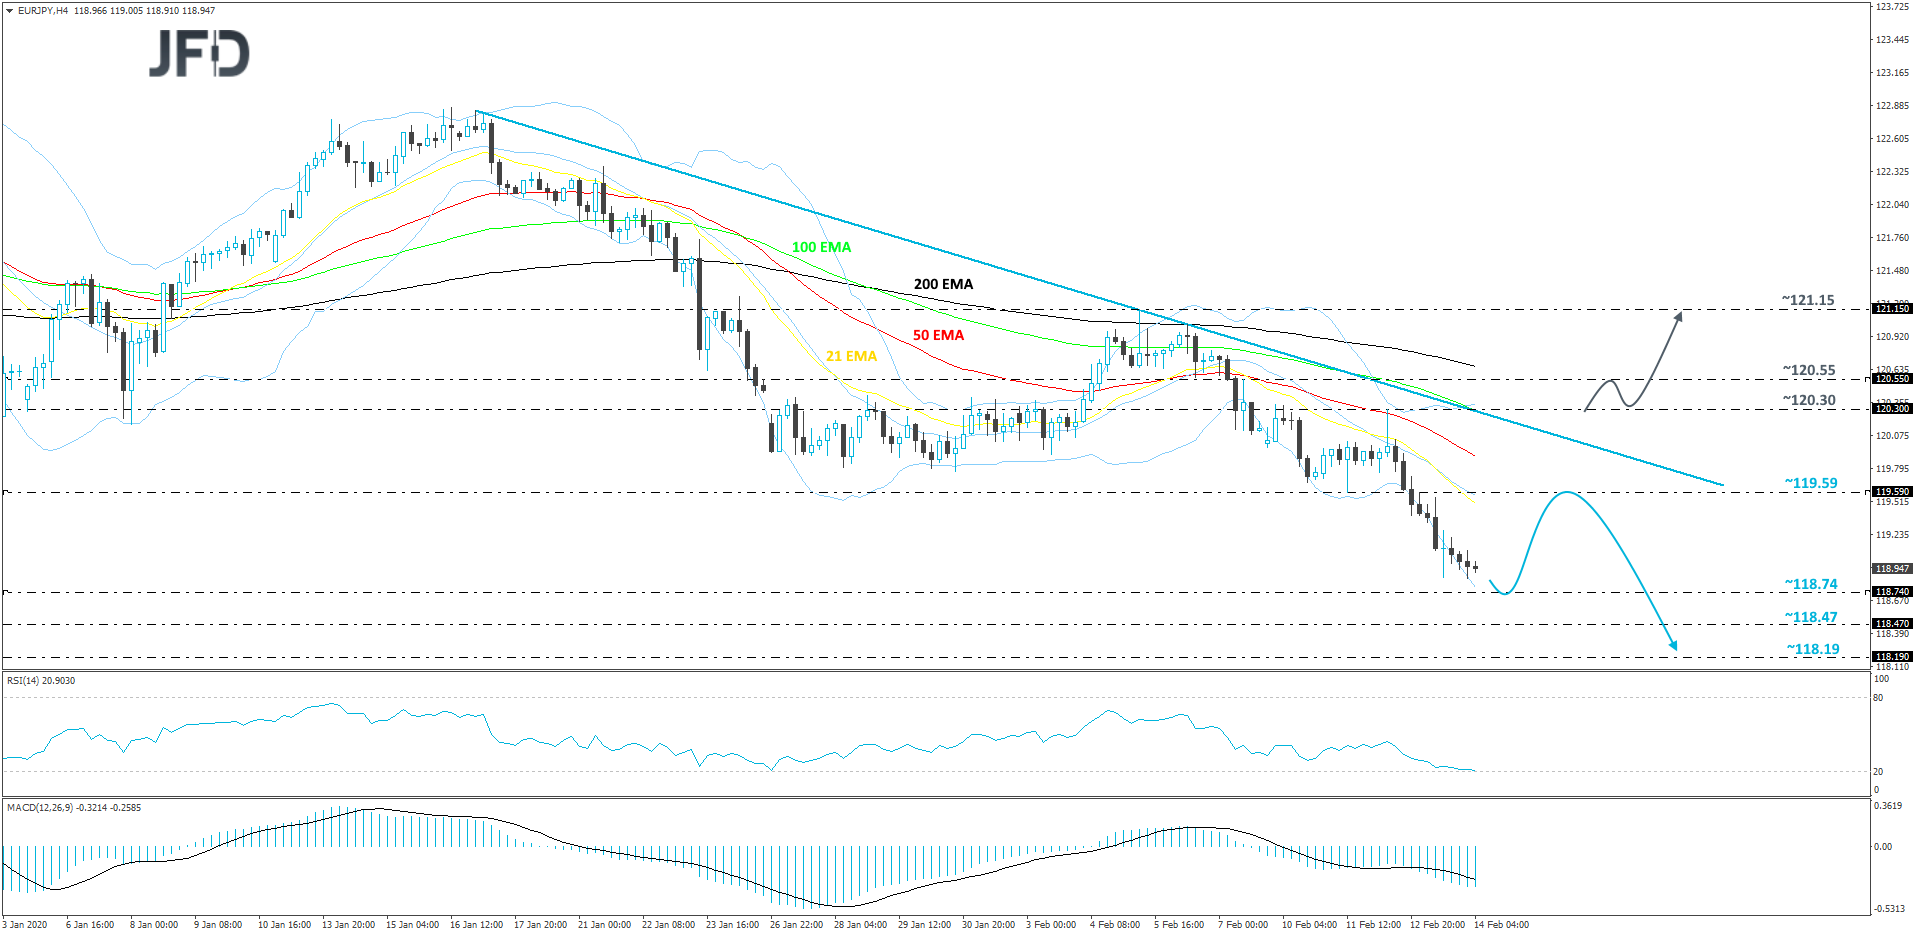
EUR/JPY – Technical Outlook
From around mid-January, EUR/JPY keeps on drifting lower, while trading below a short-term tentative downside resistance line drawn from the high of January 17th. The current price structure is of lower lows and lower highs. Although we may see some outbursts of recovery, as long as the rate remains below that downside line, we will stay bearish, at least in the near term.
The pair may slide a bit more and test the 118.74 zone, which is the low of October 11th, 2019. If the rate gets a hold-up around there, it might rebound a bit and go for a larger correction higher. But, as we mentioned above, if EUR/JPY struggles to push above the aforementioned downside line, the near-term outlook will still be somewhat bearish. This is when the bears could try and take advantage of the higher rate and drag it down again. We will aim for the 118.74 hurdle once again, a break of which could clear the way to the 118.47 area, or the 118.19 level, marked by the high of September 29th.
On the other hand, if the previously-mentioned downside line fails to withstand the bullish pressure and breaks, this may spark a bit of hope in the eyes of more buyers, especially if the rate also climbs above the 120.30 barrier, marked by the high of February 12th. EUR/JPY could then move towards the 120.55 obstacle, a break of which may open the door for a further rise, where the next potential strong resistance zone could be seen around the 121.15 level. That level is currently the highest point of February.
As for the Rest of Today’s Events
During the US session, we have the retail sales for January. Headline sales are anticipated to have grown 0.3% mom, the same pace as in December, while core sales are forecast to have slowed to +0.3% mom from +0.7% mom. What’s more, both industrial and manufacturing production for the month are expected to have slid -0.2% mom.
Following the better than expected CPIs, we now doubt that these data sets will be enough to prompt investors to bring much forth the timing of when they expect a Fed rate cut to be delivered. For that to happen, we may need to see huge disappointments. The preliminary UoM consumer sentiment index for February is also coming out and the forecast is for a small decline to 99.3 from 99.8.
