Pre-Open Market Analysis: Emini S&P 500
Friday completely reversed Thursday’s rally. Thursday was a buy climax. It followed an 8 bar bull micro channel, which is a bigger buy climax. Both are late in a 3-month buy climax. This is a set of 3 nested buy climaxes and it is therefore a parabolic wedge.
The context is good for the bears. There is a micro double top for a failed breakout above the 2018 triple top on the daily chart. The daily chart has been in a trading range for 16 months, and therefore failed breakouts are common. Finally, 80% of years have at least 2 months in the opposite direction.
Last week is a credible setup for the start of a 1 – 2 month sideways to down move. On the weekly chart, last week is a sell signal bar for a Low 2 rally. If the bears begin to get bear bars closing on their lows this week, the probability will go up.
If a 2 month selloff is beginning, it is coming after a parabolic wedge top. A selloff from a parabolic wedge often comes in the form of an Endless Pullback. That is a bull flag that just keeps adding bars. The market continues to drift down for 20 or more bars, looking like a bull flag, yet not resuming up. Then, after about 20 bars, there is a breakout up or down.
This Week Is important
What takes place this week will give traders clues about what the next 2 months will do. If the bulls quickly resume their rally and break above last week’s high, the odds will favor a new all-time high without much of a pullback beforehand. But, if the bears begins to get many bear bars, especially big bars closing on their lows, the odd will favor 1 – 2 months down, possibly to 2600 or lower.
When the bulls and bears both have credible expectations, the Emini usually has to go sideways for a few days before it decides on its direction. Unless the bulls quickly resume the rally, the odds will begin to shift in favor of the bears.
Overnight Emini Globex Trading
The Emini is down 4 points in the Globex session. Despite Friday’s strong reversal down, the bears need to break strongly below last week’s low to make traders believe that a swing down is beginning on the weekly chart.
There is no big bear bar on the daily chart breaking far below a support level. Therefore, the bulls have not yet given up. They hope that Friday was simply a pullback to the 20-day EMA.
This week will be important. At the moment, the odds favor at least a small 2nd leg down after Friday’s bear trend reversal. That means that traders expect a rally today or tomorrow.
Friday was in a trading range for the final 4 hours. The top of the range is just a few ticks below the October high of 2828.75. That has been resistance for 16 months and it is therefore a magnet early this week.
Since last week formed a good sell signal bar on the weekly chart, its low is also a magnet. Finally, Friday’s 4 hour trading range was an expanding triangle. That further increases the odds of more sideways trading. Consequently, the Emini might be mostly sideways today between 2800 and 2830.
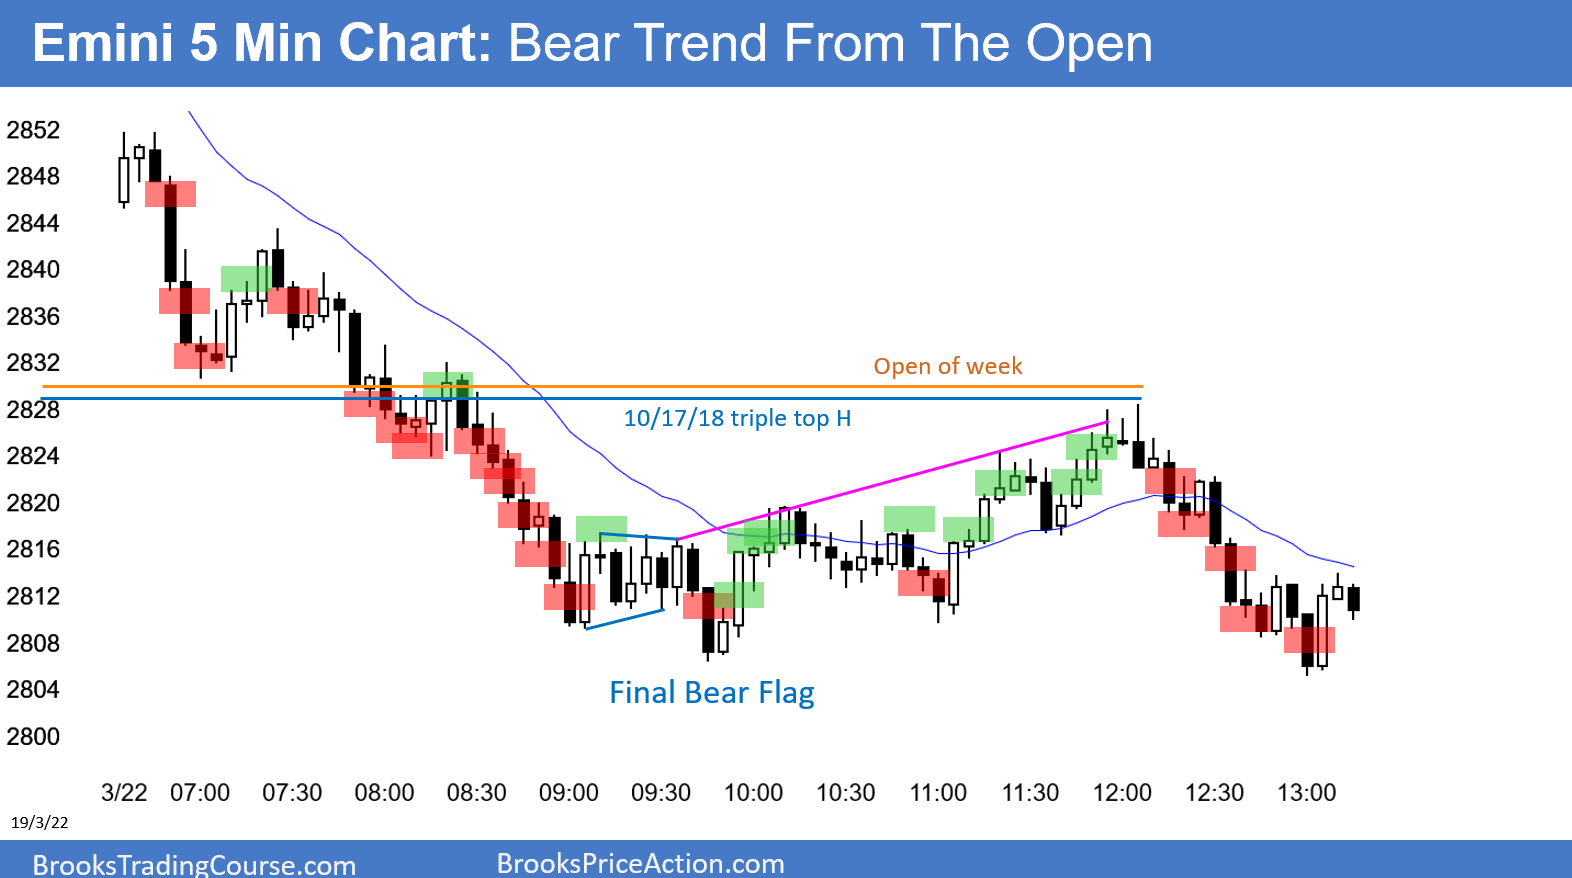
Friday’s Setups

Here are several reasonable stop entry setups from Friday. I show each buy entry with a green rectangle and each sell entry with a red rectangle. I rarely also show limit order entries and entries on the close of bars. My goal with these charts is to present an Always In perspective. If a trader was trying to be Always In or nearly Always In a position all day, and he was not currently in the market, these entries would be logical times for him to enter.
