Here's a quick check up on global equity market indices around the world:
Today, I’m giving you a glance at some emerging market equities relative to the vertical rise of the US stock market (all priced in USD of course). The majority of the time, CNBC and Bloomberg just continue to show US equity charts, as if rest of the world doesn’t even exist. I feel that it is important to check up on the whole world, especially because emerging markets account for over 75% of economic activity globally.
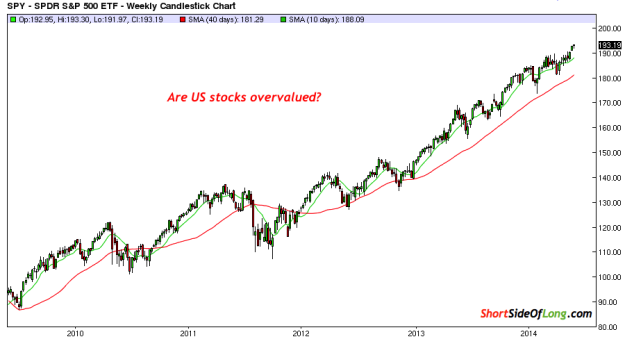
Chart 1: As US stocks rise their future return will most likely suffer
Source: Bar Chart (edited by Short Side of Long)
We’ve all seen the chart above. It’s the US stock market as represented by the SPDR S&P 500 (ARCA:SPY) rising without a serious pullback. Valuations are now approaching nosebleed levels, which is a warning signal of course. But what does that mean? Well, based on valuations alone, in the short term anything could happen. Other indicators are needed to time tops, and that's a story for another day. One thing is certain, valuation data suggest that over the long term stocks will most likely disappoint, gifting investors a negative return from current levels.
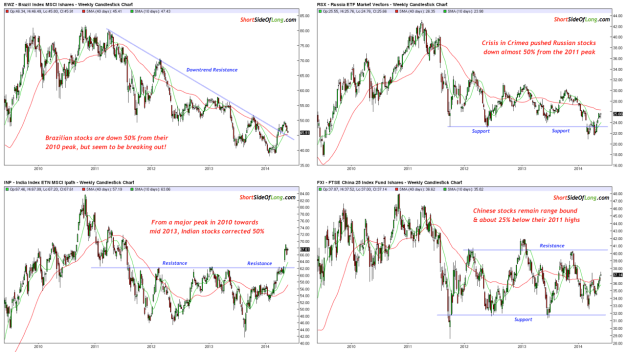
Chart 2: Majority of BRICs have suffered a 50% decline over the last 3 years
Source: Bar Chart (edited by Short Side of Long)
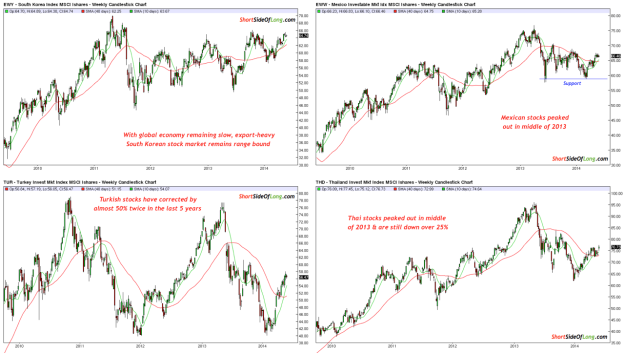
The story is quite different around the world. A lot of emerging market equity indices (priced in US dollars) have already experienced corrections as strong as 50% from their 2010/11 peaks. These include Brazil (iShares Brazil Index (ARCA:EWZ)), India (iPath MSCI India Index ETN (NYSE:INP)), Russia (MarketVectors Russia ETF (NYSE:RSX)), Turkey and so forth. Others have been range bound for years, signalling that the global export market is in the doldrums. That does not mean the selling cannot continue, but value is now coming apart in both nominal and relative terms.
Personally, I started buying Russia earlier this year during the Crimea crisis with a small position. While I am not sure it will happen, I hope we see more selling to come in both Russia and other EM economies, gifting investors even more value.
Chart 3: Korea, Mexico, Turkey and Thailand are export engines of GEMs
Source: Bar Chart (edited by Short Side of Long)


