El Paso Pipeline Partners, L.P. (EPB) owns Wyoming Interstate Company, L.L.C. (“WIC”), Southern LNG Company, L.L.C. (“SLNG”), Elba Express Company, L.L.C. (“Elba Express”), Southern Natural Gas Company, L.L.C. (“SNG”), Colorado Interstate Gas Company, L.L.C. (“CIG”) and Cheyenne Plains Investment Company, L.L.C. (“CPI”), which owns Cheyenne Plains Gas Pipeline Company, L.L.C. (“CPG”).
On February 26, 2013, EPB provided its 2012 annual report on Form 10-K. This report contains retrospective adjustments to prior financial statements to reflect changes that occurred after May 24, 2012. On that date EPB and EPB’s parent, El Paso Corporation, were acquired by Kinder Morgan, Inc. (KMI). As part of that transaction, EPB acquired the remaining 14% interest in CIG and all of CPI and CPG. EPB’s financial statements now fully consolidate CPG. Retrospective adjustments were made to prior periods to reflect this CPG consolidation and resulted in increases in net income attributable to EPB of $22 million, $40 million and $40 million for 2012, 2011 and 2010, respectively.
As a result of KMI’s acquisition of El Paso, management now assesses segment performance based on earnings before depreciation and amortization (“EBDA”). In addition to depreciation and amortization, this measure excludes interest expense and certain general and administrative expenses such as employee benefits, legal, information technology and other costs that are not deemed controllable by operating management.
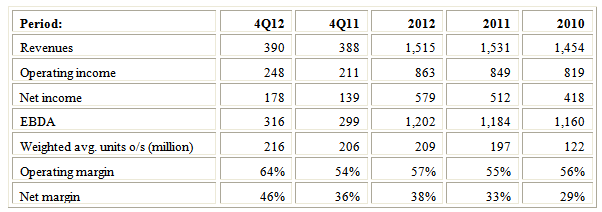
Revenues, operating income and net income were as follows:
Table 1: Figures in $ Millions, except weighted average units outstanding and margins
“Certain items” increased 2012 EBDA by $27 million as follows: 1) +$34 million of pre-acquisition EBDA related to CPG; 2) -$11 million charge to operating expenses attributable to a canceled software implementation project; 3) +$6 million non-cash adjustment to reduce environmental liabilities for certain CIG environmental projects; and 4) -$2 million amortization of regulatory assets associated with the SNG offshore asset sale.
“Certain items” increased 2011 EBDA by $99 million as follows: 1) +$85 million of pre-acquisition EBDA related to CPG; 2) +$17 million of revenue resulting from a customer’s cancellation of its commitment to Phase B of SLNG’s Elba III Expansion; and 3) -$3 million of operating expenses due to the write-off of Elba project development costs.
“Certain items” increased 2010 EBDA by $72 million (+$93 million of pre-acquisition EBDA related to CPG and -$21 million non-cash write down based on a FERC order).
Net income in 2012 was reduced by $34 million of non-cash severance costs allocated to EPB by El Paso as part of the May 24 transaction. EPB states it has not paid and is not obligated to pay any amount related to this expense.
Average throughput volumes (in terms of billion British thermal units per day) on EPB’s pipelines increased 6.8% in 2012 after decreasing 4.3% in 2011 vs. 2010.
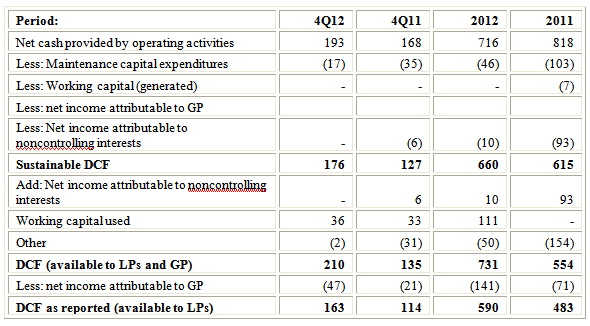
The generic reasons why distributable cash flow (“DCF”) as reported by master limited partnerships (“MLPs”) may differ from what I call sustainable DCF are reviewed in an article titled “Estimating Sustainable DCF- Why and How." EPB adopted a new definition of DCF following its acquisition by KMI and its reported DCF numbers are now based on this new definition. In an article titled "Distributable Cash Flow," I present this new definition and provide a comparison to definitions used by other master limited partnerships MLPs. After restating the numbers to conform to this new format, the comparison between reported and sustainable DCF is presented in Table 2 below: 
Sustainable DCF in 2012 exceeded the 2011 level mainly due to a reduction in distributions to minority interests and due to maintenance capital expenditures being much lower. Management projected maintenance capital expenditures to total $55-60 million in 2012. The actual number was much lower ($46 million) compared to ~$100 million actually spent in 2011 and ~$94 million actually spent in 2010 when EPB was controlled by EL Paso Corporation. Management expects to spend an even lower amount ($40 million) in 2013. Whether the lower levels of maintenance capital expenditure level are sufficient is an open question.
The major differences between reported and sustainable DCF are attributable to working capital and various items grouped under “Other."
In deriving reported DCF for 2012 management added back to net cash from operations $111 million of working capital used ($36 million in 4Q12). Under EPB’s definition, reported DCF always excludes working capital changes, whether positive or negative. In contrast, as detailed in my prior articles, in deriving sustainable DCF I generally do not add back working capital used but, on the other hand, I exclude working capital generated. Despite appearing to be inconsistent, this makes sense because in order to meet my definition of sustainability the master limited partnerships should, on the one hand, generate enough capital to cover normal working capital needs. On the other hand, cash generated from working capital is not a sustainable source and I therefore ignore it. Over reasonably lengthy measurement periods, working capital generated tends to be offset by needs to invest in working capital. I therefore do not add working capital consumed to net cash provided by operating activities in deriving sustainable DCF.
Items in the “Other” category include numerous adjustments. These adjustments further illustrate the complexity and subjectivity surrounding DCF calculations and highlight the difficulty of comparing MLPs based on their reported DCF numbers. For example, items included in 2012 include non-cash severance costs, pre acquisition costs, and loss on write-off of assets. I exclude these adjustments from my definition of sustainable DCF.
Distributions, reported DCF, sustainable DCF and the resultant coverage ratios are shown in below. Note that the coverage ratio I calculate compares total DCF to total distributions to all unitholders (including the general partner). DCF as reported by EPB is DCF available to limited partners (i.e., after distributions made to the general partner). The comparison of reported vs. sustainable coverage shown below therefore includes the reported number had it been calculated pre distribution to the general partner. This adjustment is shown on the third line of Table 3: 
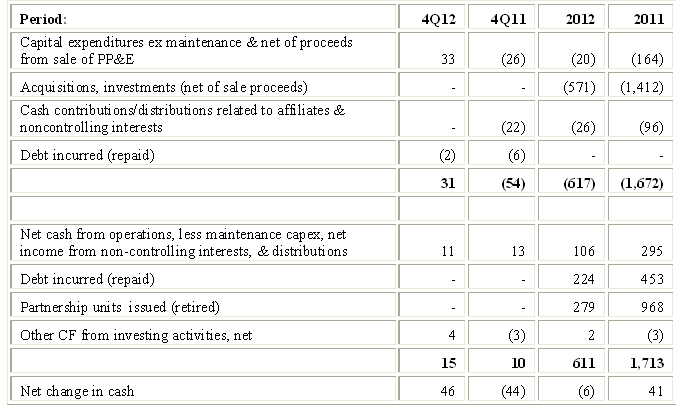
I find it helpful to look at a simplified cash flow statement by netting certain items (e.g., acquisitions against dispositions) and by separating cash generation from cash consumption.
Here is what I see for EPB:
Simplified Sources and Uses of Funds 
Net cash from operations, less maintenance capital expenditures, less cash related to net income attributable to non-partners exceeded distributions by $106 million in 2012 and by $295 million in 2011. EPB is not using cash raised from issuance of debt and equity to fund distributions.
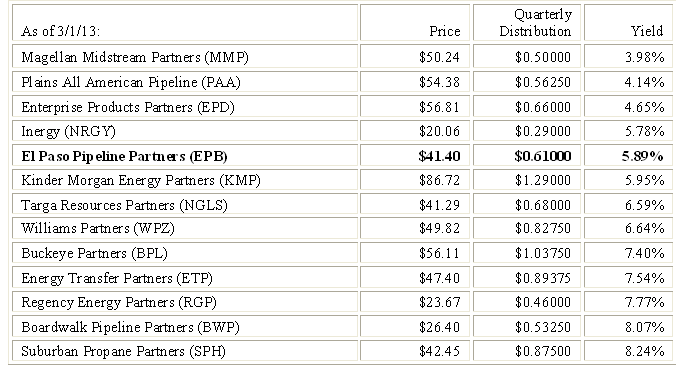
Table 5 below compares KMP’s current yield to some of the other MLPs I follow: 
4Q12 growth at EPB was driven by completion of expansion projects at SNG, the CIG and CPG drop-downs, by significant increased demand from natural-gas-fired power plants (particularly at SNG where power generation demand was up 30% in 4Q12 and 42% in 2012), and by cost savings achieved after KMI became EPB’s general partner. The cut in maintenance capital expenditures also contributed to the positive change vs. 4Q11. My concerns about these cuts are based on gut feel. But I recognize that it is quite possible that management prudently generated cost savings (including in maintenance expenditures). In 2013, EPB is expected to purchase KMI’s 50% interest in Gulf LNG. There is always a concern regarding these related-party transactions but again I expect management to deal with this prudently and structure an accretive deal for the limited partners. The concern that EPB will be treated as a stepchild by KMI has, in my view, dissipated. While Kinder Morgan Energy Partners LP (KMP) accounts for the bulk of the $11 billion of expansion projects under way at the Kinder Morgan entities, its 2013 projected distribution growth is 6% compared to 13% for EPB. I therefore continue to hold EPB.
- English (UK)
- English (India)
- English (Canada)
- English (Australia)
- English (South Africa)
- English (Philippines)
- English (Nigeria)
- Deutsch
- Español (España)
- Español (México)
- Français
- Italiano
- Nederlands
- Português (Portugal)
- Polski
- Português (Brasil)
- Русский
- Türkçe
- العربية
- Ελληνικά
- Svenska
- Suomi
- עברית
- 日本語
- 한국어
- 简体中文
- 繁體中文
- Bahasa Indonesia
- Bahasa Melayu
- ไทย
- Tiếng Việt
- हिंदी
El Paso Pipeline Partners' Distributable Cash Flow: A Closer Look
Published 03/04/2013, 05:37 AM
Updated 07/09/2023, 06:31 AM
El Paso Pipeline Partners' Distributable Cash Flow: A Closer Look
3rd party Ad. Not an offer or recommendation by Investing.com. See disclosure here or
remove ads
.
Latest comments
Install Our App
Risk Disclosure: Trading in financial instruments and/or cryptocurrencies involves high risks including the risk of losing some, or all, of your investment amount, and may not be suitable for all investors. Prices of cryptocurrencies are extremely volatile and may be affected by external factors such as financial, regulatory or political events. Trading on margin increases the financial risks.
Before deciding to trade in financial instrument or cryptocurrencies you should be fully informed of the risks and costs associated with trading the financial markets, carefully consider your investment objectives, level of experience, and risk appetite, and seek professional advice where needed.
Fusion Media would like to remind you that the data contained in this website is not necessarily real-time nor accurate. The data and prices on the website are not necessarily provided by any market or exchange, but may be provided by market makers, and so prices may not be accurate and may differ from the actual price at any given market, meaning prices are indicative and not appropriate for trading purposes. Fusion Media and any provider of the data contained in this website will not accept liability for any loss or damage as a result of your trading, or your reliance on the information contained within this website.
It is prohibited to use, store, reproduce, display, modify, transmit or distribute the data contained in this website without the explicit prior written permission of Fusion Media and/or the data provider. All intellectual property rights are reserved by the providers and/or the exchange providing the data contained in this website.
Fusion Media may be compensated by the advertisers that appear on the website, based on your interaction with the advertisements or advertisers.
© 2007-2024 - Fusion Media Limited. All Rights Reserved.
