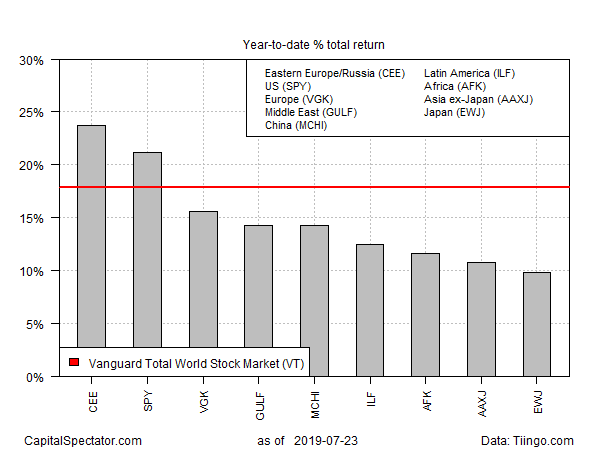
This year’s rally in stocks has left no major region of the world untouched by animal spirits. But the appetite for risk is strongest in Eastern Europe/Russia, closely followed by the United States, based on year-to-date returns via a set of exchange-listed products that represent the main economic regions on the planet.
Leading the field by wide margin: Central and Eastern Europe Fund (NYSE:CEE), a closed-end fund that is currently the only US-exchange-listed portfolio targeting this area of the world. CEE surged 23.7% so far in 2019 through yesterday’s close (July 23). In the wake of this year’s rally, the fund is trading close to a six-year high.
US stocks are the second-best performer this year, nipping at the heels of CEE’s gain. SPDR S&P 500 (NYSE:SPY) is up 21.6% in 2019 through last night’s close. The ETF’s current price is just slightly below an all-time record high, which was touched earlier this month.

The rest of the world’s major equity regions are well behind CEE and SPY, although even the weakest performer has delivered a solid return: iShares MSCI Japan (EWJ) is sitting on a 9.9% year-to-date increase so far in 2019.
One of the more striking aspects related to this year’s rally in everything for global equities is the apparent discounting of the manufacturing sector’s weakness throughout much of the world economy. It’s unclear if the crowd is assuming that manufacturing is poised to rebound soon. Or maybe animal spirits have run amuck and investors are oblivious to the implied risks. Another possibility: the calculus is that manufacturing’s role as a business-cycle factor no longer carries the weight it once did (a subject briefly discussed here).
Whatever the answer, there’s no doubt that manufacturing has had a rough time in recent history. Today’s PMI data for the Eurozone, for instance, reveals that the currency bloc’s manufacturing recession deepened last month. “The manufacturing sector has become an increasing cause for concern,” observes Chris Williamson, chief business economist at HIS Markit. “Geopolitical worries, Brexit, growing trade frictions and the deteriorating performance of the autos sector, in particular, has pushed manufacturing into a deeper downturn with the survey indicative of the goods-producing sector contracting at a quarterly rate of approximately 1%.”
The state of US manufacturing is stronger, but the sector has downshifted this year. The ISM Manufacturing Index, for instance, eased in June, leaving this proxy for the sector close to a three-year low and just above the level that signals contraction. “Manufacturing is clearly taking it on the chin from the rising trade uncertainty,” noted Chris Rupkey, chief economist at MUFG.
The hard data on US manufacturing is also reflecting weakness lately. By the Federal Reserve’s estimate, the one-year trend in output has slowed lately, easing to a state of more or less flatlining.
Meanwhile, survey data indicates that China’s manufacturing sector contracted last month. The Caixin/Markit factory Purchasing Managers’ Index for June was below 50, showing that manufacturing activity slumped last month.
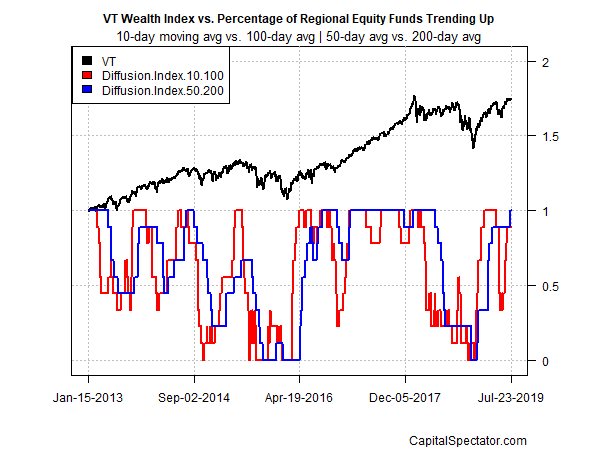
For now, at least, the world’s equity investors have shrugged off weak manufacturing data. Only time will tell if that’s wise or short-sighted. Based on recent prices, the crowd is committed to betting on the former in no trivial degree. Consider, for example, a momentum profile of the funds listed above—a profile that continues to indicate a strong upside bias, based on two sets of moving averages. The first definition compares the 10-day moving with the 100-day average, a measure of short-term trending behavior (red line in chart below). A second set of moving averages (50 and 200 days) offers an intermediate measure of the trend (blue line). The indexes range from 0 (all funds trending down) to 1.0 (all funds trending up). Based on this data through yesterday’s close, the bullish climate (which stumbled earlier this year) is back in high gear and so it appears that the future is priced for perfection, according to the “wisdom” of the crowd.

