
The Dun & Bradstreet Corporation (NYSE:DNB) reported disappointing third-quarter 2018 results, wherein both earnings and revenues missed the Zacks Consensus Estimate.
Adjusted EPS came in at $1.85, which lagged the consensus mark by 15 cents. However, the figure improved 3.4% on a year-over-year basis. Total revenues of $407.3 million missed the consensus mark by $26.3 million and declined 4.9% year over year, both before and after the effect of foreign exchange.
Adjusted revenues totaled $416.7 million, which declined 3.1% year over year, both before and after the effect of foreign exchange. Also, organic revenues decreased 3% on a year-over-year basis.
As of Sep 30, 2018, deferred revenues were $528.9 million, per ASC 606 standards. Deferred revenues, as of Sep 30, 2018, were $615.3 million, up 1% year over year.
On Aug 8, 2018, Dun & Bradstreet announced that it has agreed to be acquired by an affiliate of CC Capital. The transaction, valued at $6.9 billion, is expected to be completed by the end of this year.
Notably, shares of Dun & Bradstreet have gained 25.1% in a year’s time, outperforming the 13.9% growth of the industry.

Segmental Performance
Revenues at the Americas segment amounted to $336.3 million (83% of total revenues), down 4% year over year, both before and after the effect of foreign exchange. Adjusted revenues of $342.8 million declined 3% year over year.
In terms of product lines, adjusted Risk Management Solutions revenues from Americas totaled $202.9 million, flat year over year, both before and after the effect of foreign exchange. Adjusted Sales and Marketing Solutions revenues from the region came in at $139.9 million, down 7% year over year.
Revenues at the Non-Americas segment summed $71 million (17% of total revenues), which declined a respective 5% and 7% year over year before and after the effect of foreign exchange. Adjusted revenues of $73.9 million decreased 2% and 3% year over year before and after the effect of foreign exchange, respectively.
In terms of product lines, adjusted Risk Management Solutions revenues from Non-Americas were $61.9 million, up 4% year over year before the foreign exchange impact and 3% after the same. Adjusted Sales and Marketing Solutions revenues from the region amounted to $12 million, which decreased a respective 24% and 25% year over year before and after the foreign exchange impact.
Dun & Bradstreet Corporation (The) Price, Consensus and EPS Surprise
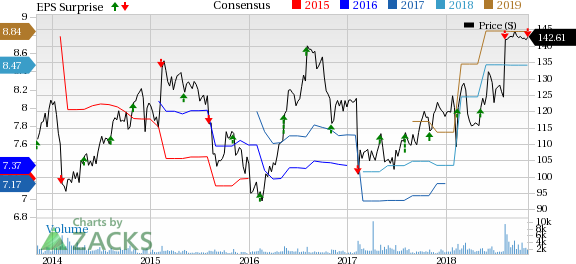
Dun & Bradstreet Corporation (The) Price, Consensus and EPS Surprise | Dun & Bradstreet Corporation (The) Quote
Operating Results
Adjusted operating income for the third quarter was $105.8 million, down 7.2% from the prior-year quarter. Adjusted operating margin of 25.4% declined 110 basis points (bps) from the year-ago quarter.
Balance Sheet and Cash Flow
Dun & Bradstreet exited third-quarter 2018 with cash and cash equivalents balance of $228.2 million compared with $199.5 million in the last reported quarter. Long-term debt at the end of the quarter was $1.31 billion, flat sequentially.
The company generated $72.7 million of cash from operating activities and spent $1.4 million on Capex. Free cash flow was $58.2 million.
Zacks Rank & Upcoming Releases
Dun & Bradstreet currently has a Zacks Rank #3 (Hold). You can see the complete list of today’s Zacks #1 Rank (Strong Buy) stocks here.
Investors interested in the broader Business Services sector are keenly awaiting upcoming quarterly releases from Avis Budget Group, Inc. (NASDAQ:CAR) , Genpact Limited (NYSE:G) , and Broadridge Financial Solutions, Inc. (NYSE:BR) . While Avis Budget Group will release result on Nov 5, Genpact and Broadridge will announce the same on Nov 6.
Today's Stocks from Zacks' Hottest Strategies
It's hard to believe, even for us at Zacks. But while the market gained +21.9% in 2017, our top stock-picking screens have returned +115.0%, +109.3%, +104.9%, +98.6%, and +67.1%.
And this outperformance has not just been a recent phenomenon. Over the years it has been remarkably consistent. From 2000 - 2017, the composite yearly average gain for these strategies has beaten the market more than 19X over. Maybe even more remarkable is the fact that we're willing to share their latest stocks with you without cost or obligation.
Avis Budget Group, Inc. (CAR): Free Stock Analysis Report
Dun & Bradstreet Corporation (The) (DNB): Free Stock Analysis Report
Genpact Limited (G): Free Stock Analysis Report
Broadridge Financial Solutions, Inc. (BR): Free Stock Analysis Report
Original post