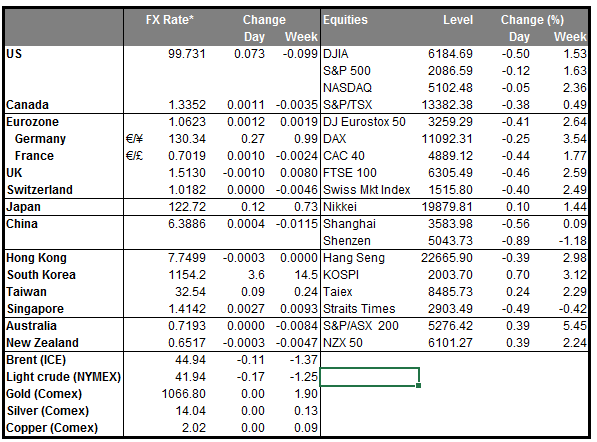
• Dollar index touched briefly the psychological 100 level The dollar reached a 7 month high against a basket of currencies, underpinned by expectations that the Fed is on track to raise rates in December. With a December Fed rate hike priced around 74%, up from around 70% on Friday, the focus stays on the US data and on Fed speakers going into the meeting. As we continue to see improvement in the US fundamentals, the prospect for a rate hike increases and this could support the greenback further.
• US crude oil trades below USD 43 per barrel Benchmark West Texas Intermediate crude for January delivery and Brent crude oil moved higher on Monday after Saudi Arabia repeated pledge to work with OPEC and other producers towards oil price stability. However, the advance stayed limited as concerns about a global supply glut and signs of rising US stockpiles remained intact. Even though we had similar pledges before, the Saudis and other big OPEC producers have kept output high to maintain market share. As a result, I would prefer to see a real shift in policy at OPEC’s next meeting on December 4 to trust that the output will be indeed restrained. In such case, we could see oil prices moving higher.
• Today’s highlights: During the European day, from Germany, the Ifo survey for November is being released. The forecast is for the current assessment index to decline slightly, while the expectations index to tick up a bit. Both the ZEW indices have recovered as the effects of the Volkswagen (DE:VOWG_p) scandal started to fade away and therefore, we may see a positive surprise in the Ifo indices as well. This could support EUR a bit. The German final GDP for Q3 confirmed the preliminary estimate and showed that the economy grew at a 0.3% qoq pace in Q3. The reaction in the markets was muted as we didn’t had any huge revision in the GDP figure.
• From the US, we get the 2nd estimate of the Q3 GDP. The forecast is for the growth rate to be revised up to +2.0% qoq from +1.5% qoq. Although this will still point to a slowdown compared to the astonishing print of 3.9% qoq in Q2, given the positive data coming out from the US, we still believe that the economic recovery remains on track. After all, these encouraging data are one of the main reasons the Fed is considering December as an appropriate time for a Fed fund rate hike. The 2nd estimate of the core PCE deflator for Q3, the Fed’s favorite inflation measure, is also due out. The forecast is for the 1.3% qoq growth rate of the first estimate to be confirmed. Additionally, the S & P/Case-Shiller house price index for September is expected to have slightly accelerated from the previous month, which in addition to the positive housing starts and building permits released last week, could signal further improvement in the US housing sector. Finally, the Conference Board consumer confidence index is expected to have increased slightly in November, following October’s moderate decline. This could suggest an improvement in the short-term US outlook and add to USD gains.
• We have three speakers on Tuesday’s agenda. ECB Governing Council members Carlos Costa and Francois Villeroy de Galhau speak, while from the RBA we have Governor Glenn Stevens.
The Market
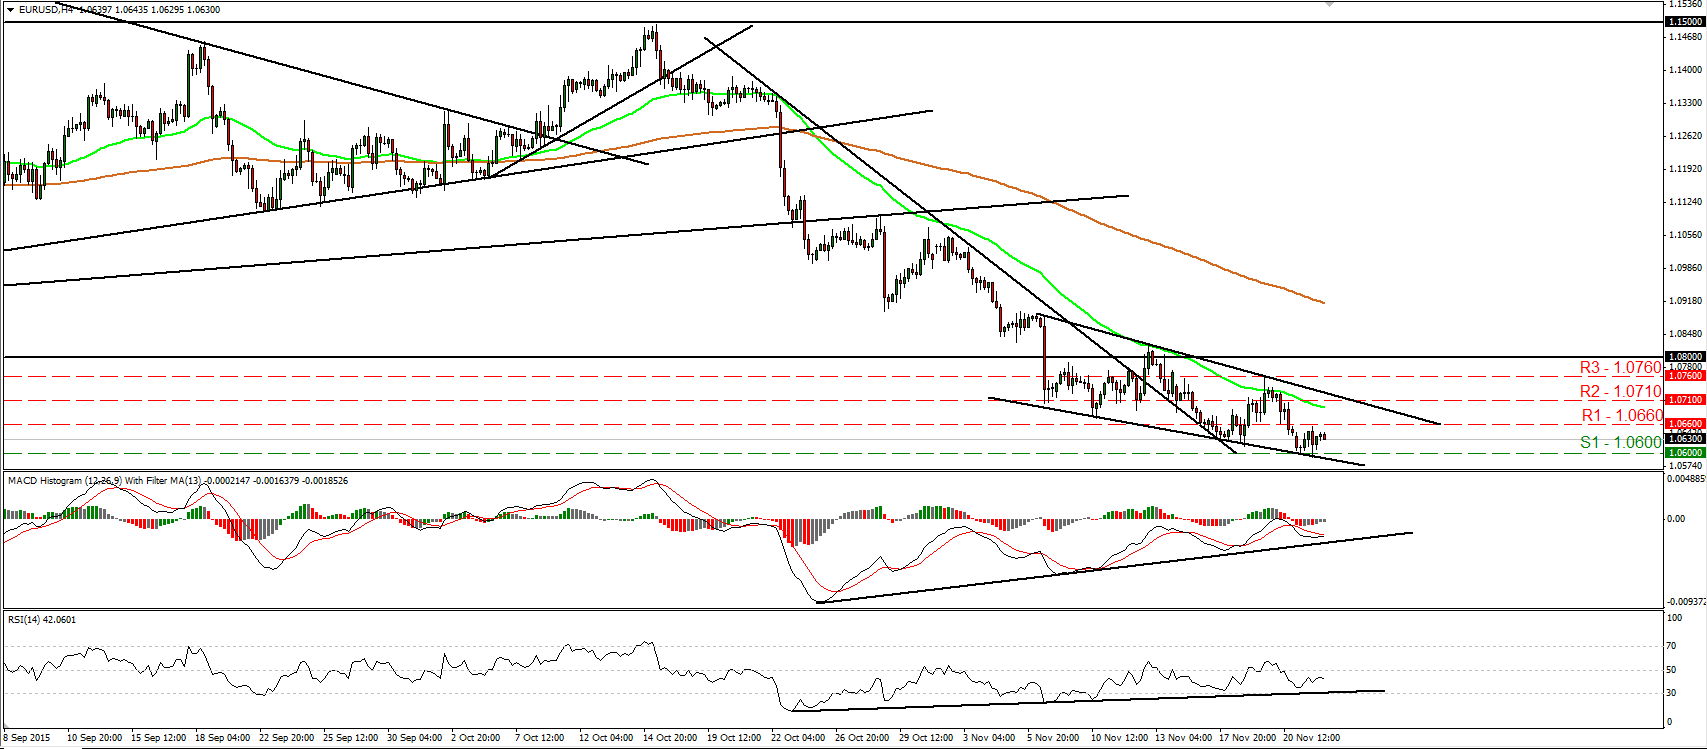
EUR/USD falls below 1.0630
• EUR/USD fell briefly below 1.0600 (S1) on Monday, but rebounded immediately to trade in a consolidative manner between that barrier and the resistance of 1.0660 (R1). The short-term trend remains negative in my view and therefore, I would expect a clear break below 1.0600 (S1) to open the way for our next support of 1.0570 (S2), defined by the low of the 15th of April. However, taking a look at our momentum studies, I see signs that a corrective bounce could be on the cards before the bears seize control again. The RSI rebounded from near its upside support line, while the MACD, although negative, has bottomed and could move above its trigger line soon. Also, there is still positive divergence between both these indicators and the price action. In the bigger picture, as long as the pair is trading below 1.0800, the lower bound of the range it had been trading since the last days of April, I would consider the longer-term outlook to stay negative. I would treat any possible near-term advances that stay limited below 1.0800 as a corrective phase.
• Support: 1.0600 (S1), 1.0570 (S2), 1.0530 (S3)
• Resistance: 1.0660 (R1), 1.0710 (R2), 1.0760 (R3)
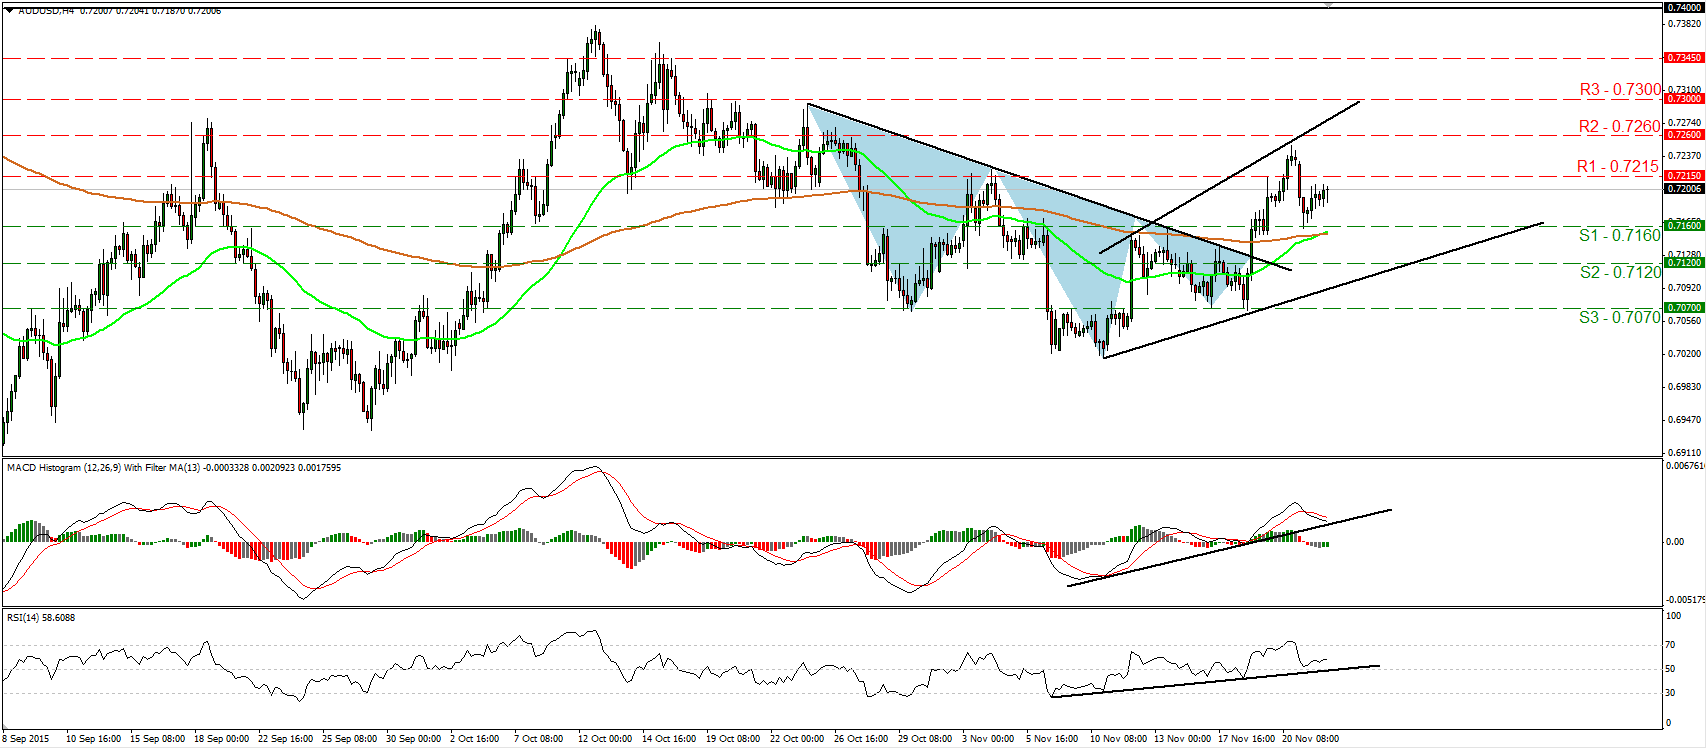
AUD/USD rebounds from 0.7160
• AUD/USD traded higher yesterday after it hit support at 0.7160 (S1). Following the completion of an inverted head and shoulders on the 18th of November, I would consider the short-term outlook to have turned positive. Therefore, I would expect a clear move above 0.7215 (R1) to initially target the 0.7260 (R2) resistance zone. Our momentum studies reveal positive momentum and support somewhat the case for further advances. The RSI rebounded from near its 50 line, while the MACD, although below its trigger line, stands within its positive territory and shows signs that it could start bottoming. Switching to the daily chart, I see that AUD/USD still oscillates between 0.6900 and 0.7400 since mid-July. As a result, although the short-term uptrend may continue, I would hold a flat stance for now as far as the broader trend is concerned.
• Support: 0.71460 (S1), 0.7120 (S2), 0.7070 (S3)
• Resistance: 0.7215 (R1), 0.7260 (R2), 0.7300 (R3)
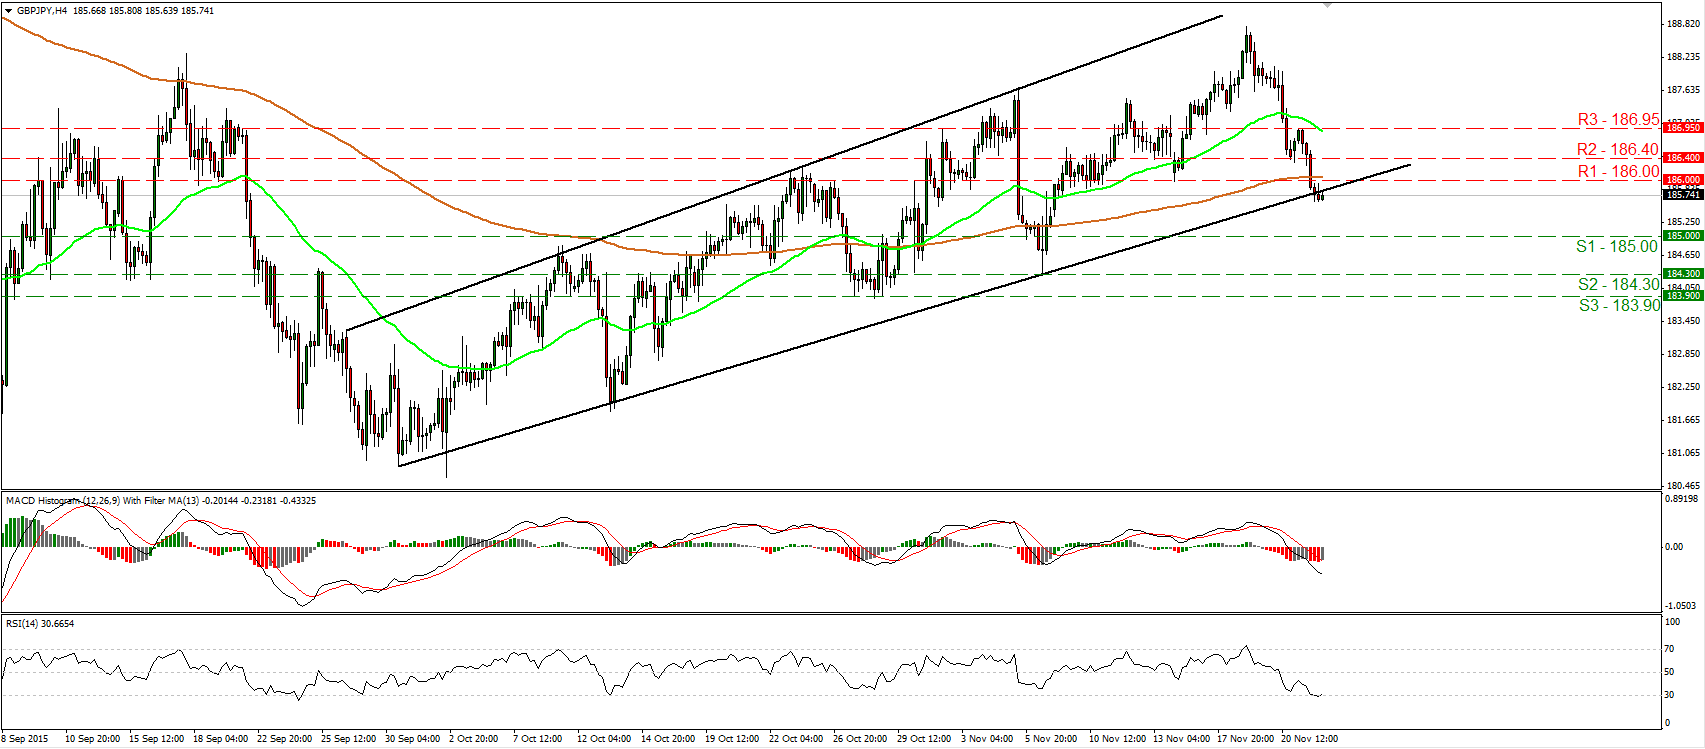
GBP/JPY breaks below 186.00
• GBP/JPY continued trading lower yesterday and managed to break below the key support (now turned into resistance) zone of 186.00 (R1) and the uptrend line taken from the low of the 30th of September. The short-term outlook has now turned negative in my view and thus, I would expect the negative move to continue and perhaps challenge the psychological zone of 185.00 (S1). Our momentum studies detect downside momentum and support the notion. The RSI turned down and challenged its 30 line, while the MACD stands below both its zero and trigger lines, pointing south. Nevertheless, the RSI has turned somewhat up after hitting its 30 line, something that gives evidence of a possible corrective bounce before the next leg down. On the daily chart, yesterday’s break below the uptrend line taken from the low of the 30th of September make me adopt a flat stance as far as the longer-term picture is concerned.
• Support: 185.00 (S1), 184.30 (S2), 183.90 (S3)
• Resistance: 186.00 (R1), 186.40 (R2), 186.95 (R3)
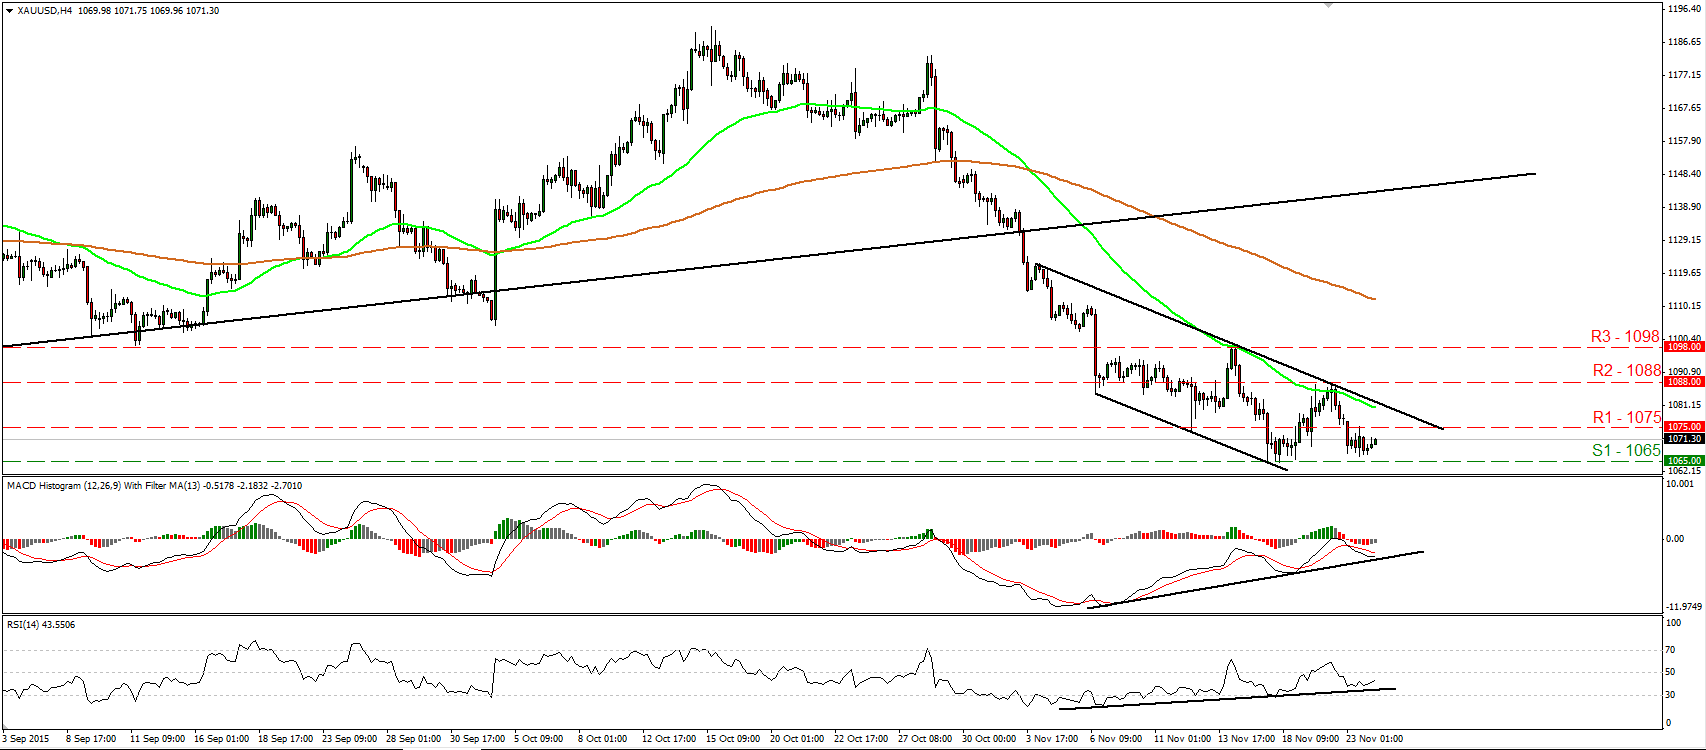
Gold rebounds from slightly above 1065
• Gold traded somewhat higher yesterday after it found support marginally above the 1065 (S1) support zone. The short-term trend remains negative in my view. The metal still trades within a short-term downside channel that has been containing the price action since the 4th of November. As a result, I would expect a clear move below 1065 (S1) to open the way for our next support hurdle of 1055 (S2). However, for now I see signs that an upside retracement could be in the works before the next negative leg. The RSI rebounded from near its upside support line and could be headed towards its 50 line, while the MACD, although negative, shows signs of bottoming and that it could cross above its trigger line soon. What is more, there is still positive divergence between both these studies and the price action. On the daily chart, I see that the plunge below the upside support line taken from the low of the 20th of July has shifted the medium-term outlook to the downside. As a result, I believe that the metal is poised to continue its down road in the foreseeable future.
• Support: 1065 (S1), 1055 (S2), 1050 (S3)
• Resistance: 1075 (R1), 1088 (R2), 1098 (R3)
WTI rebounds from 40.50
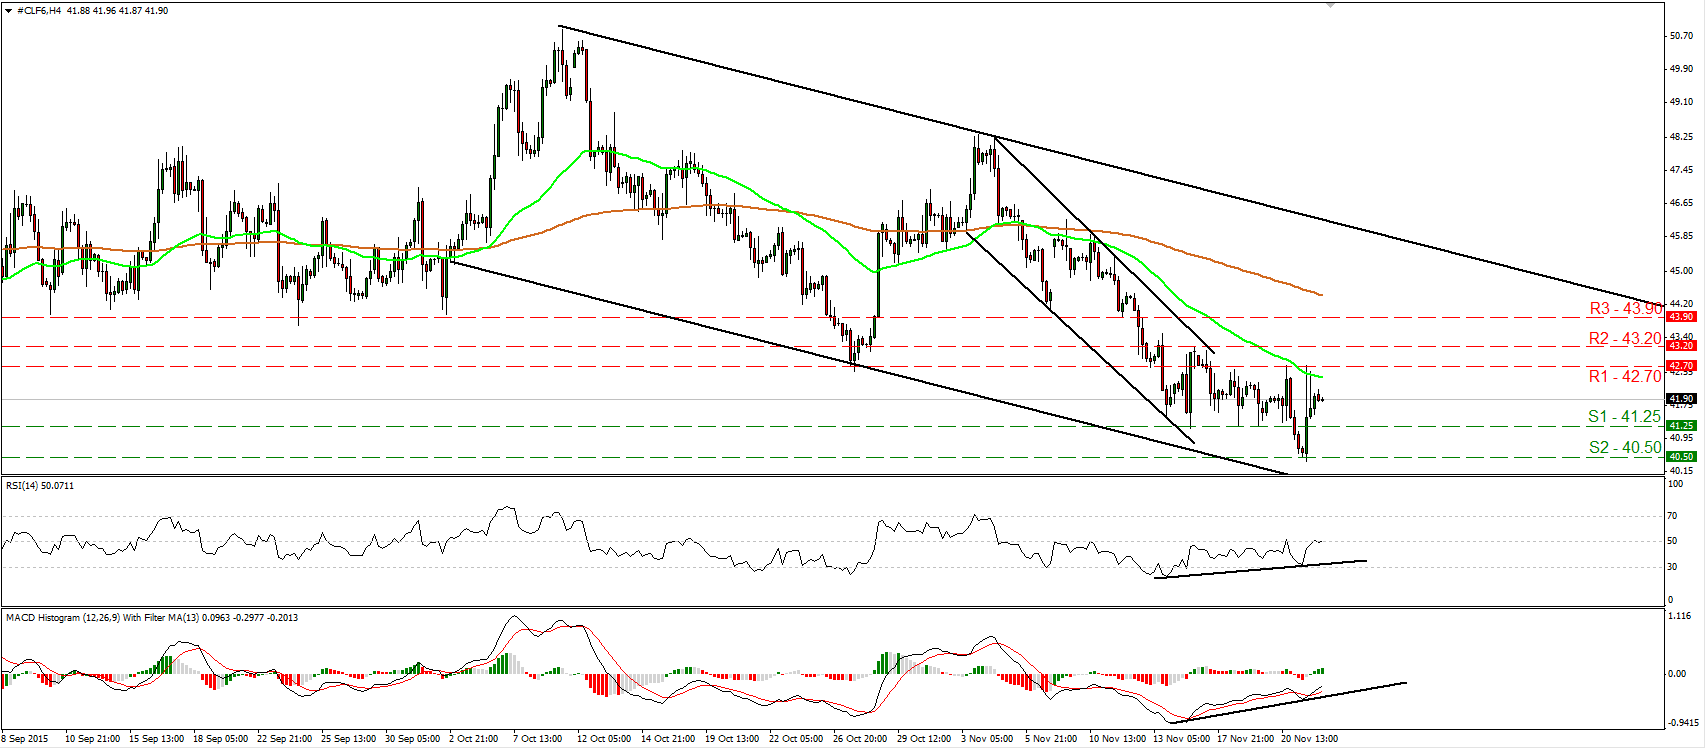
• WTI rebounded strongly yesterday from near the 40.50 (S2) barrier after Saudi Arabian minister for petroleum and mineral resources showed willingness to cooperate with OPEC in an effort to stabilize oil prices. The price rallied on the news but hit resistance at 42.70 (S3) and then it retreated somewhat. Although the price structure still points to a short-term downtrend, I would switch my stance to flat for now. Shifting my attention to our short-term oscillators, I see that the RSI rebounded from near 30 and is now testing its 50 line, while the MACD, although negative, has bottomed and emerged above its trigger line. There is also positive divergence between both these indicators and the price action. These signs make me believe that further upside correction could be looming before the bears decide to take in charge again. On the daily chart, WTI has been printing lower peaks and lower troughs within a downside channel since the 9th of October. Therefore, I would consider the medium-term outlook to be negative as well and I would treat any further near-term advances as a corrective move of that down path.
• Support: 41.25 (S1), 40.50 (S2), 40.00 (S3)
• Resistance: 42.70 (R1), 43.20 (R2), 43.90 (R3)

