EUR/USD
The euro closed the first trading day in 2015 below psychological 1.2000 level, with further weakness signaled by week’s gap-lower opening. The price dipped below 1.1900 handle, posting fresh low at 1.1860. Consolidative phase is under way and holding below 1.2000 barrier, which now acts as strong resistance and should ideally cap corrective attempts on oversold near-term studies. Overall negative sentiment is reinforced by negative fundamentals, which keep the single currency pressured. Close below 1.20 resistance to confirm completion of monthly bear-flag, as all critical supports were met and next significant support lies at 1.1640, low of 2005, below which to open 1.12100, Fibonacci 61.8% of multi-year 0.8225/1.6039 ascend. Near-term bears would be delayed in case of regain and close above 1.20 handle, also Fibonacci 38.2% of 1.2220/1.1860 downleg
Res: 1.1975; 1.2000; 1.2040; 1.2068
Sup: 1.1925; 1.1900; 1.1860; 1.1800 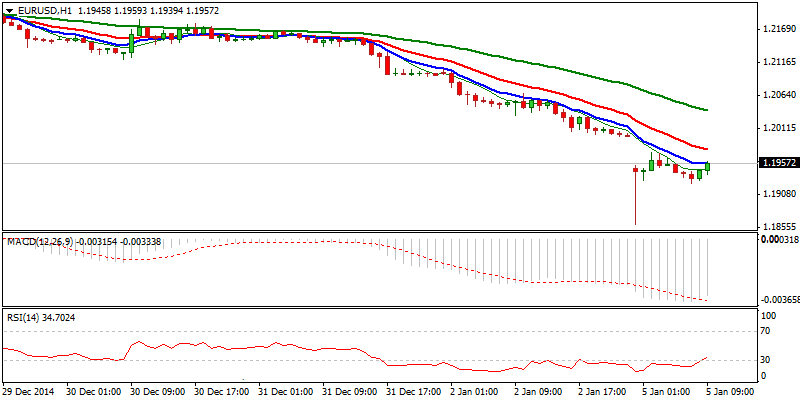
EUR/JPY
The pair remains under pressure and dipped below 143.80, Fibonacci 38.2% of 134.12/149.76 support, following daily / weekly close in red and gap higher opening today, which spiked to 143.02, level last time traded in Nov 2014. Weekly close below previous low at 144.94 and daily indicators establishing in negative territory, support further retracement of 134.12/149.76 rally, with 142 zone, higher platform / 50% retracement, seen as next target. Corrective rallies on oversold near-term studies, should be ideally contained at 145.30/40 zone, hourly lower platform / daily Ichimoku cloud top, in case of filling overnight’s gap and sustained break above 144 barrier.
Res: 144.10; 144.63; 145.00; 145.30
Sup: 143.59; 143.02; 142.50; 142.00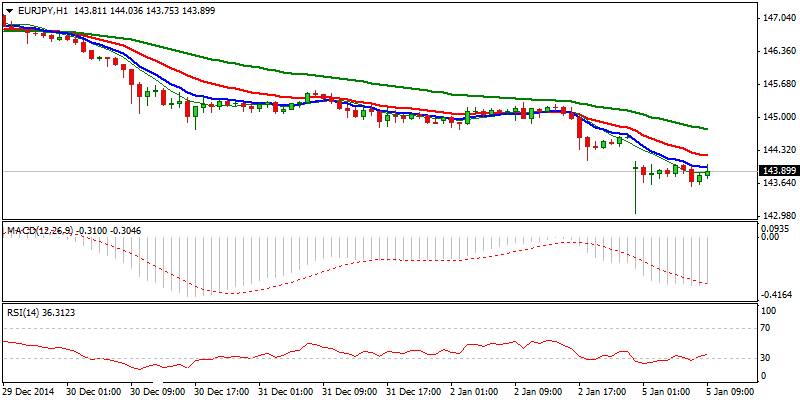
GBP/USD
Cable dipped to the new low at 1.5166, heading towards psychological 1.5000 support, on fresh acceleration and weekly gap lower opening. Last Friday’s long red candle signals resumption of larger downtrend, interrupted by mid-Nov / end of Dec consolidation, for eventual full retracement of 1.4812/ 1.7189 ascend of July 2013/ July 2014. Oversold near-term conditions suggest corrective action, which so far holds below last week’s closing level at 1.5330. Break here to accelerate correction towards 1.5400 and 1.5445, Fibonacci 61.8% of 1.5618/1.5166, where extended rallies should be ideally capped.
Res: 1.5330; 1.5400; 1.5445; 1.5500
Sup: 1.5271; 1.5200; 1.5166; 1.5100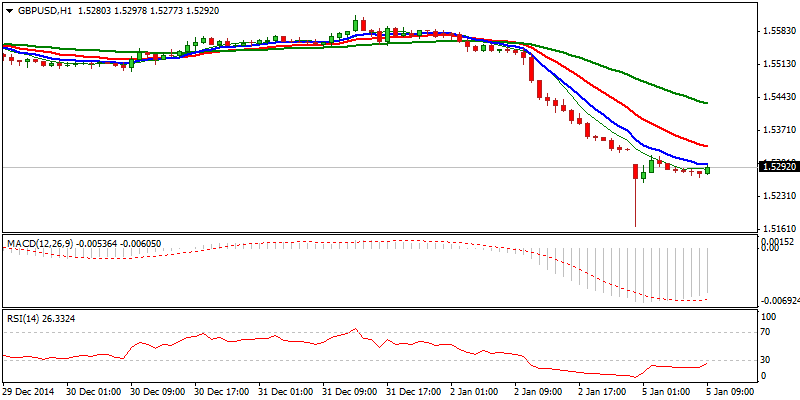
USD/JPY
The pair remains in consolidative phase under 121 barrier, after corrective dips were contained at 118.80, Fibonacci 38.2% of 115.55/120.81 upleg, reinforced by daily Kijun-sen line. Break and close above 120 handle, keeps focus at the upside, as near-term studies turned positive and see scope for break above near–term congestion tops and eventual retest of key 121.83 peak, posted on 08 Dec. Only break below 118.80 support would neutralize bulls.
Res: 120.73; 120.81; 121.00; 121.83
Sup: 120.00; 119.80; 119.25; 118.85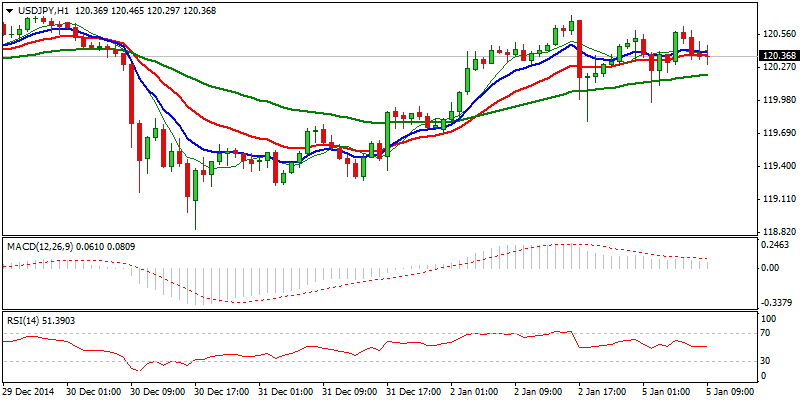
AUD/USD
The pair remains under pressure and heads towards psychological 0.8000 support, after completion of near-term consolidative phase, which was capped by descending daily 20SMA at 0.8213. Daily/weekly close in red supports further weakness and test of initial 0.8000 target and 0.7945, Fibonacci 61.8% retracement of 0.6007/1.1079 ascend, in extension. Session high at 0.8104, offer good resistance, ahead of 0.8145 lower top and Fibonacci 61.8% of 0.8213//0.8034 downleg, where rallies are expected to be ideally limited. Only clearance of 0.8213 breakpoint would neutralize near-term bears.
Res: 0.8104; 0.8130; 0.8145; 0.8182
Sup: 0.8034; 0.8000; 0.7945; 0.7900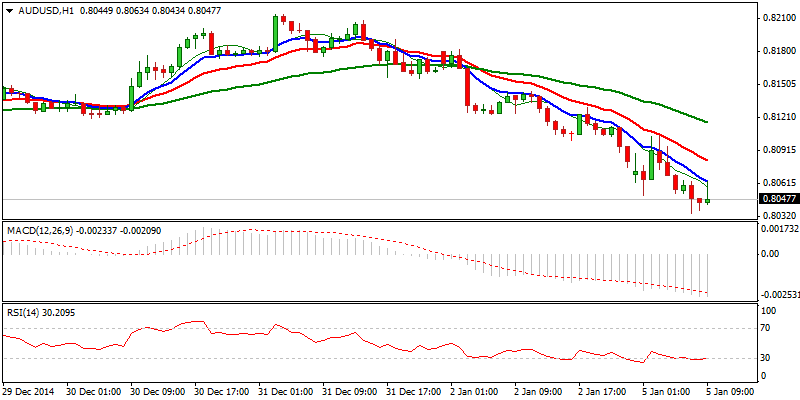
AUD/NZD
Near-term studies turned bullish, as the price rallies higher and closed on Friday above psychological 1.05 barrier, signaling extension of near-term corrective phase. Reversing daily studies support the notion for stronger corrective action, before final break below critical multi-year support zone. Close above daily 20SMA, currently at 1.0563, would be a signal of extended correction, towards next resistance at 1.07 zone, near Fibonacci 61.8% of 1.0864/1.0418 downleg.
Res: 1.0563; 1.0600; 1.0641; 1.0700
Sup: 1.0527; 1.0493; 1.0458; 1.0438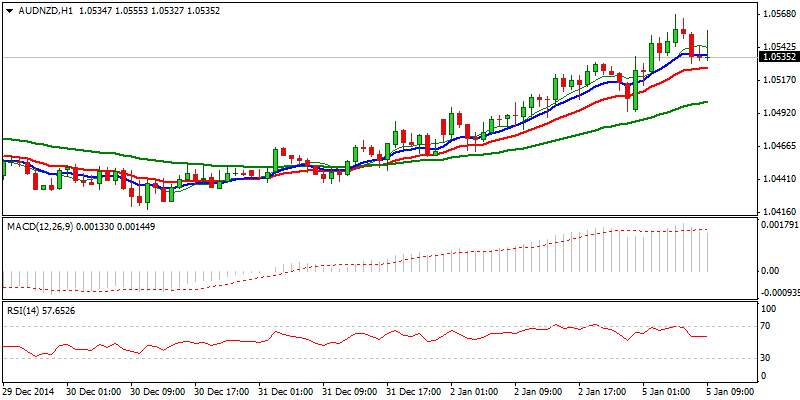
XAU/USD
Spot gold trades in choppy near-term mode, with downside risk being sidelined after last Friday’s probe below strong 1170 support, low of 22Dec and subsequent bounce near 1200 barrier. Friday’s close was positive, however, long legged candle signals hesitation, which requires close above 20SMA at 1197 and psychological 1200 barrier, to be confirmed. This scenario is expected to open next targets at 1210/13 and 12224 in extension. Otherwise, prolonged sideways trade between 1167 and 1200, could be expected in case of repeated failure at 1200 resistance zone, as studies of 4-hour chart are neutral and dailies are negatively aligned.
Res: 1200; 1210; 1213; 1224
Sup: 1191; 1177; 1170; 1167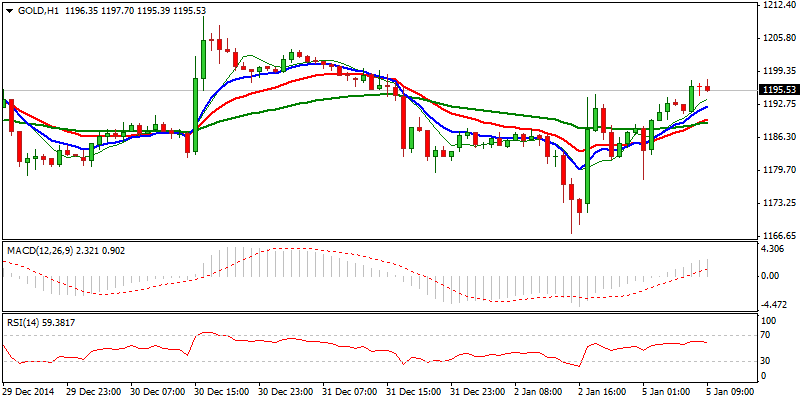
- English (UK)
- English (India)
- English (Canada)
- English (Australia)
- English (South Africa)
- English (Philippines)
- English (Nigeria)
- Deutsch
- Español (España)
- Español (México)
- Français
- Italiano
- Nederlands
- Português (Portugal)
- Polski
- Português (Brasil)
- Русский
- Türkçe
- العربية
- Ελληνικά
- Svenska
- Suomi
- עברית
- 日本語
- 한국어
- 简体中文
- 繁體中文
- Bahasa Indonesia
- Bahasa Melayu
- ไทย
- Tiếng Việt
- हिंदी
Daily Market Outlook: January 5, 2015
Published 01/05/2015, 05:30 AM
Updated 02/21/2017, 08:25 AM
Daily Market Outlook: January 5, 2015
Latest comments
Loading next article…
Install Our App
Risk Disclosure: Trading in financial instruments and/or cryptocurrencies involves high risks including the risk of losing some, or all, of your investment amount, and may not be suitable for all investors. Prices of cryptocurrencies are extremely volatile and may be affected by external factors such as financial, regulatory or political events. Trading on margin increases the financial risks.
Before deciding to trade in financial instrument or cryptocurrencies you should be fully informed of the risks and costs associated with trading the financial markets, carefully consider your investment objectives, level of experience, and risk appetite, and seek professional advice where needed.
Fusion Media would like to remind you that the data contained in this website is not necessarily real-time nor accurate. The data and prices on the website are not necessarily provided by any market or exchange, but may be provided by market makers, and so prices may not be accurate and may differ from the actual price at any given market, meaning prices are indicative and not appropriate for trading purposes. Fusion Media and any provider of the data contained in this website will not accept liability for any loss or damage as a result of your trading, or your reliance on the information contained within this website.
It is prohibited to use, store, reproduce, display, modify, transmit or distribute the data contained in this website without the explicit prior written permission of Fusion Media and/or the data provider. All intellectual property rights are reserved by the providers and/or the exchange providing the data contained in this website.
Fusion Media may be compensated by the advertisers that appear on the website, based on your interaction with the advertisements or advertisers.
© 2007-2024 - Fusion Media Limited. All Rights Reserved.
