
CVS Health Corporation’s (NYSE:CVS) fourth-quarter 2019 adjusted earnings per share (EPS) of $1.73 dropped 19.2% year over year but exceeded the Zacks Consensus Estimate by 2.9%. The quarter’s adjusted EPS considered certain transaction and integration costs pertaining to the buyout of Aetna (NYSE:AET) and asset amortization costs along with other adjustments.
On a reported basis, the company’s earnings of $1.33 per share came in against the year-ago loss of 37 cents.
Full-year adjusted EPS of $7.08 was unchanged from the year-ago period but topped the Zacks Consensus Estimate by 0.7%.
Total revenues in the fourth quarter rose 22.9% year over year (excluding the impact of certain items that neither relate to the ordinary course of CVS Health’s business nor reflect the company’s underlying business performance, adjusted revenues increased 23.1% year over year) to $66.89 billion. The top line also beat the Zacks Consensus Estimate by 4.2%.
CVS Health Corporation Price, Consensus and EPS Surprise
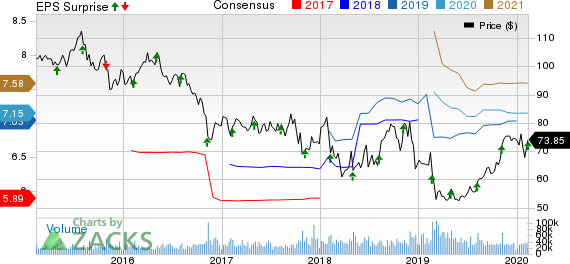
CVS Health Corporation price-consensus-eps-surprise-chart | CVS Health Corporation Quote
The year-over-year revenue rise was primarily driven by the acquisition of Aetna, expanded volume and the brand name drug price inflation in both the Pharmacy Services and Retail/LTC segments, partially offset by a persistent reimbursement pressure in the Retail/LTC, continued price compression in the Pharmacy Services segment and an increased generic dispensing rate.
Full-year total revenues and adjusted revenues surged 32% and 32.3%, respectively, to reach $256.7 billion. This too exceeded the Zacks Consensus Estimate by 1.1%.
Quarter in Detail
Earlier in 2019, CVS Health realigned the composition of its segments. As a result, the company’s SilverScript Medicare Part D prescription drug plan (PDP) was shifted from the Pharmacy Services segment to Health Care Benefits. In addition, the mail order and specialty pharmacy operations of Aetna were transitioned from the Health Care Benefits segment to Pharmacy Services.
Pharmacy Services revenues were up 6.2% to $37.07 billion in the reported quarter, driven by growth in total pharmacy claims volume and the brand name drug price inflation. This was, however, partially offset by a continued price compression and an increase in generic dispensing rate.
Total pharmacy claims processed rose 10.2% on a 30-day equivalent basis, attributable to net new business and the steady adoption of Maintenance Choice offerings.
Revenues from CVS Health’s Retail/LTC were up 2.5% year over year to $22.58 billion. Per the company, the result was based on higher prescription volume and branded drug price inflation, partially offset by a persistent reimbursement pressure and the impact of an increased generic dispensing rate. Front store revenues represented 22.7% of total Retail/LTC revenues in the reported quarter, primarily banking on improved sales of health and beauty products.
Total prescription volume grew 5.6% on a 30-day equivalent basis, boosted by the steady uptake of patient care programs, collaborations with PBMs and the company’s preferred status in a number of Medicare Part D networks.
Within Health Care Benefits segment, the company registered revenues worth $17.15 billion in the fourth quarter.
Gross profit soared 79.1% to $24.82 billion. Accordingly, gross margin expanded 1165 bps to 37.1%. Adjusted operating margin in the quarter under review grew 1086 bps to 24.2% on a 123.1% rise in operating profit to $16.17 billion.
Outlook
CVS Health has provided its 2020 guidance.
Adjusted EPS is expected in the band of $7.04-$7.17. The Zacks Consensus Estimate for 2020 earnings is pegged at $7.15.
This apart, the company’s 2020 adjusted operating profit is estimated in the $15.5-$15.8 billion range.
Further, the company’s full-year cash flow from operations is envisioned in the bracket of $10.5-$11 billion.
Our Take
CVS Health ended the fourth quarter on a promising note with both earnings and revenues trumping the respective Zacks Consensus Estimate. Moreover, the year-over-year improvement in the top line was fueled by strong growth in Pharmacy Services segment, which benefited from the upside in specialty services. The company’s recently-introduced Health Care Benefits segment following the Aetna acquisition also holds immense promise.
Additionally, solid year-over-year Retail/LTC comparisons were encouraging. Strong expansion of both margins further buoys optimism on the stock. However, the LTC business is facing some industry-wide challenges.
Zacks Rank and Key Picks
CVS Health carries a Zacks Rank #3 (Hold). Some better-ranked stocks having already reported solid results this earning season are Stryker Corporation (NYSE:SYK) , Accuray Incorporated (NASDAQ:ARAY) and ResMed Inc. (NYSE:RMD) .
Stryker delivered fourth-quarter 2019 adjusted EPS of $2.49, outpacing the Zacks Consensus Estimate by 1.2%. Fourth-quarter revenues of $4.13 billion also surpassed the Zacks Consensus Estimate by 0.7%. The company carries a Zacks Rank #2 (Buy). You can see the complete list of today’s Zacks #1 Rank (Strong Buy) stocks here.
Accuray reported second-quarter fiscal 2020 adjusted earnings per share (EPS) of a penny, showing a marked improvement from the Zacks Consensus Estimate of a loss of 7 cents. Further, net revenues of $98.8 million outshined the Zacks Consensus Estimate by 0.3%. The company sports a Zacks Rank #1.
ResMed flaunts a Zacks Rank of 1 reported second-quarter fiscal 2020 adjusted EPS of $1.21, surpassing the Zacks Consensus Estimate by 19.8%. Additionally, its revenues of $736.2 million beat the consensus mark by 1.5%.
Today's Best Stocks from Zacks
Would you like to see the updated picks from our best market-beating strategies? From 2017 through 2019, while the S&P 500 gained and impressive +53.6%, five of our strategies returned +65.8%, +97.1%, +118.0%, +175.7% and even +186.7%.
This outperformance has not just been a recent phenomenon. From 2000 – 2019, while the S&P averaged +6.0% per year, our top strategies averaged up to +54.7% per year.
See their latest picks free >>
Stryker Corporation (SYK): Free Stock Analysis Report
Accuray Incorporated (ARAY): Free Stock Analysis Report
CVS Health Corporation (CVS): Free Stock Analysis Report
ResMed Inc. (RMD): Free Stock Analysis Report
Original post
Zacks Investment Research