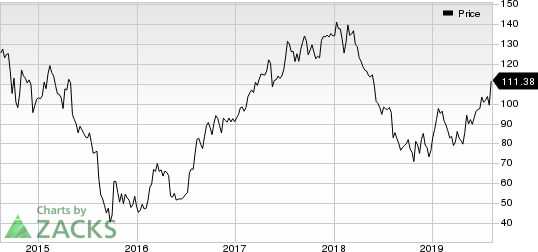
Copa Holdings (NYSE:CPA) reported lackluster traffic figures for July, wherein load factor (% of seats filled by passengers) declined as traffic reduction was more than capacity contraction in the month.
Also, traffic, measured in revenue passenger miles (RPMs), decreased 2.6% year over year to 1.96 billion in the month. On a year-over-year basis, consolidated capacity (available seat miles/ASMs) inched down 0.8% year over year to 2.26 billion. Load factor declined 1.7 percentage points to 86.6%.
In the first seven months of 2019, the carrier generated RPMs of 12.55 billion, down 0.5% year over year and ASMs of 14.84 billion (down 1.2%). Load factor increased 0.6 percentage points to 84.6% during the same period as capacity contraction was more than the traffic decline on a year-to-date basis.
Notably, Copa Holdings’ July traffic report comes close on the heels of its second-quarter 2019 earnings report, wherein this Zacks Rank #1 (Strong Buy) stock delivered better-than-expected earnings and revenues. However, both capacity and traffic declined in the reported quarter. You can see the complete list of today’s Zacks #1 Rank stocks here.
Furthermore, Copa Holdings, which competes with the likes of GOL Linhas (NYSE:GOL) , Azul (NYSE:AZUL) and LATAM Airlines (NYSE:LTM) in the Latin American aviation space, lowered its 2019 capacity guidance due to the grounding of the Boeing (NYSE:BA) 737 MAX jets in its fleet. The carrier now anticipates capacity to slip 2% year over year compared to an increase of 1% expected previously. This Latin American carrier currently has a fleet size of 104, comprising six Boeing 737 MAX9, 82 Boeing 737NG and 16 Embraer-190 jets.
Today's Best Stocks from Zacks
Would you like to see the updated picks from our best market-beating strategies? From 2017 through 2018, while the S&P 500 gained +15.8%, five of our screens returned +38.0%, +61.3%, +61.6%, +68.1%, and +98.3%.
This outperformance has not just been a recent phenomenon. From 2000 – 2018, while the S&P averaged +4.8% per year, our top strategies averaged up to +56.2% per year.
See their latest picks free >>
Gol Linhas Aereas Inteligentes S.A. (GOL): Free Stock Analysis Report
Copa Holdings, S.A. (CPA): Free Stock Analysis Report
LATAM Airlines Group S.A. (LTM): Free Stock Analysis Report
AZUL SA (AZUL): Free Stock Analysis Report
Original post
Zacks Investment Research

