Deap Capital Management Trust (LAGOS:DEAPCAP) produced a solid performance in Q119, with the alternative asset management division benefiting from performance-related fees, continuing its platform development, and launching new funds. NAV and the net cash position remained robust, and an unchanged €0.12 per share dividend was paid on 22 May 2019. We forecast a similar distribution in FY19, representing a prospective yield of more than 9%. Following the dividend payment, our adjusted net asset value per share is €1.75.

Strong AAM fees in Q119
Alternative AUM was c €11.9bn at end-Q119, similar to Q418 but up from €11.6bn at end-Q118. Commission income was a strong €16.9m compared with €14.4m in Q118, and benefiting from performance-related fees. Fund launches have continued, with the DeA Capital Alternative Funds-managed DeA Endowment Fund, aimed specifically at banking foundations. Group NAV increased slightly compared to FY18, but fell c 1% in per-share terms, reflecting treasury shares issued in exchange for the remaining minority in DeA Capital Real Estate. The holding company financial position remains strong, at €92.5m, or c 20% of NAV, ahead of the c €31m dividend distribution later in May, substantially matched by c €23m of dividend upstreaming from the AAM business. Shareholders have approved the cancellation of 40m treasury shares, with effect from August. This will have no impact on liquidity, NAV or EPS.
Platform investment
Already a leader in Italy in alternative assets, providing an integrated platform comprising private equity, real estate and non-performing loans, DeA has a strong, liquid balance sheet, with high levels of cash flow, to support further growth in Italy and into wider Europe. 100% ownership of DeA Capital Real Estate represents a simpler, more flexible and potentially more efficient base from which to expand the real estate platform from Italy into broader Europe. The recent creation of real estate advisory and consultancy subsidiaries in Spain and France are the first steps in this development.
Valuation: Cash flow for yield and growth
The discount to IFRS NAV (€1.70 after payment of dividend) has narrowed over the past year (to c 25%), but DeA still has the lowest P/BV among a range of peers. The discount to our adjusted NAV (see page 5) of €1.75 (ex-dividend) is slightly larger still. A strong balance sheet and cash flow position support an attractive yield, and provide resources for investment to grow AAM further.
Business description
DeA Capital, a De Agostini group company, is Italy’s leading alternative asset manager of real estate, private equity and NPLs, with AUM of c €11.9bn at 31 March 2019. The investment portfolio, including co-investment in funds managed, investment in the asset management platform and direct investment, amounted to c €372m.
Summary of Q119 developments
The main developments in Q119 involve the continuing development of DeA’s alternative asset management platform, including completion of the buyout of minorities in DeA Capital Real Estate. The key features of the Q119 financial report and other recent developments were:
As at 31 March 2019 (Q119), alternative assets under management (AUM) were c €11.9bn, up from c €11.6bn at end-Q118 and at a similar level to end FY18. Commission income was significantly ahead, at €16.9m compared with €14.4m in Q118.
In Q119, AAM commission income continued to benefit from performance fees earned on the Investitori Associati IV private equity fund, originally promoted by Investitori Associati SGR but managed in run-off by DeA Capital Alternative Funds since 2015. We believe the Q119 performance fee contribution was c €2.5m, a similar level to Q418. Although the performance fees are non-recurring in nature, DeA management is hopeful that the continuing run-off process will generate further payments, while over the medium term it hopes to benefit from performance fees/carried interest in other funds.
The year-on-year increase in AUM includes a significant contribution from new fund launches, partially offset by fund maturities and liquidations. During FY18 new funds launched and managed by DeA’s alternative asset management platform amounted to c €1.3bn, including eight new DeA Capital Real Estate funds (c €1.0bn), and the launches of IDeA Capital Agro Fund (€80m commitment) and the shipping segment (‘CCR Shipping’) of the IDeA Corporate Credit Recovery II Fund (€170m commitment). During Q119, DeA Capital Alternative Funds launched the DeA Endowment Fund, a closed-end fund of funds intended for investment by banking foundations, and was awarded the management of a portion of Azimut Capital managed ‘Azimut Private Debt’ closed-end fund. Together, these new mandates added €114m to AUM.
DeA Capital’s measure of the AAM platform operating performance came to €4.2m, compared with €3.2m in Q118.
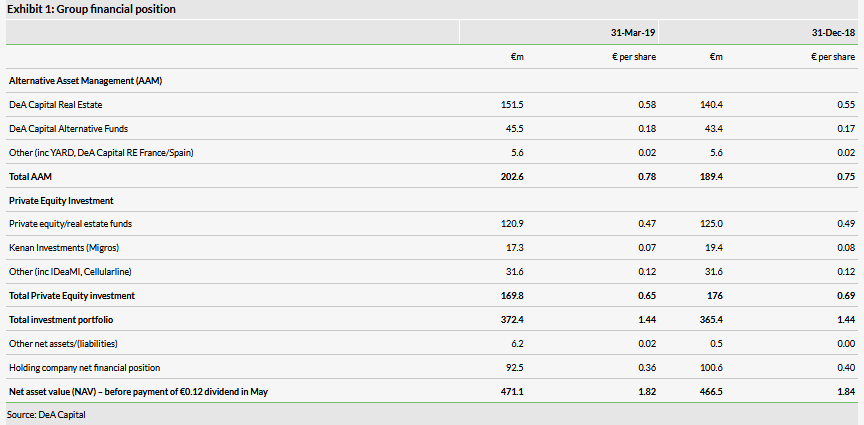
The group investment portfolio, comprising its investment in the AAM platform (€202.6m), as well as its direct (€48.9m) and fund investments (€120.9m), was €372.4m at end-Q119 compared to €365.4m at end-FY18. The value of the AAM platform benefited from the further elimination of minority interests, while generally negative revaluation movements slightly reduced the value of the direct and fund investments.
In March 2019, DeA acquired the remaining 6% minority interest in DeA Capital Real Estate from Fondazione Carispezia, a private foundation that remains one of the main shareholders in the Italian bank, Credit Agricole (PA:CAGR) Carispezia. The €8m consideration, at book value, was settled with DeA treasury shares, which are subject to a six-month lock-up. The agreement also includes a maximum earnout of €0.9m. DeA Capital now owns 100% of the subsidiary, underlining its focus on the growth of its AAM platform, increasing the share of AAM earnings within the group, and simplifying the corporate structure.
The net financial position of the holding company remained strongly positive, at €92.5m or c 20% of NAV. Group NAV increased c 1% in Q119 compared with end-FY18, to €471.1m, but was slightly lower in per-share terms at €1.82 (cum-div) compared with €1.84. The number of shares in issue (excluding treasury shares) was increased by c 5.2m (to 259.3m) by the treasury share settlement of the DeA Capital Real Estate minority acquisition.
Since the end of Q119, the holding company net financial position has benefited from a €22.9m dividend distribution from the AAM business, a significant increase from €7.5m in 2018.
On 18 April 2019, the shareholders meeting approved the cancellation of 40m treasury shares (approximately 17% of the share capital), acquired over the past few years under its ongoing share repurchase programme. Although this will have no impact on reported liquidity, NAV, earnings or EPS, as the treasury shares are deducted from this calculation, we welcome the move as we believe it shows that management believes its significant net positive financial position is sufficient to support its current growth plans without the need to reissue the shares. Should this situation change, management can make the case for new share issuance based on the merits of the investment opportunity. As the shares are in any case withdrawn from the market, cancellation should have no negative impact on share trading liquidity.
The reason for the cancellation is that with ongoing repurchases, the free float has recently fallen beneath the minimum level that is required to maintain DeA’s listing in the STAR market segment of Borsa Italiana’s Mercato Telematico Azionario (MTA) equity market. Following the cancellation, which takes effect in August, the parent company, De Agostini, will own 67.1% of the shares (currently 17.3%), with 2.5% remaining in treasury and a free float of 30.4% (currently 24.4%).
The shareholder meeting also approved the payment of a €0.12 per share distribution on 22 May 2019, maintaining DeA’s strong cash distribution record, supported by a highly liquid balance sheet and strong cash flow, the latter benefiting from ongoing maturing fund investments.
Forecasts and valuation
AAM
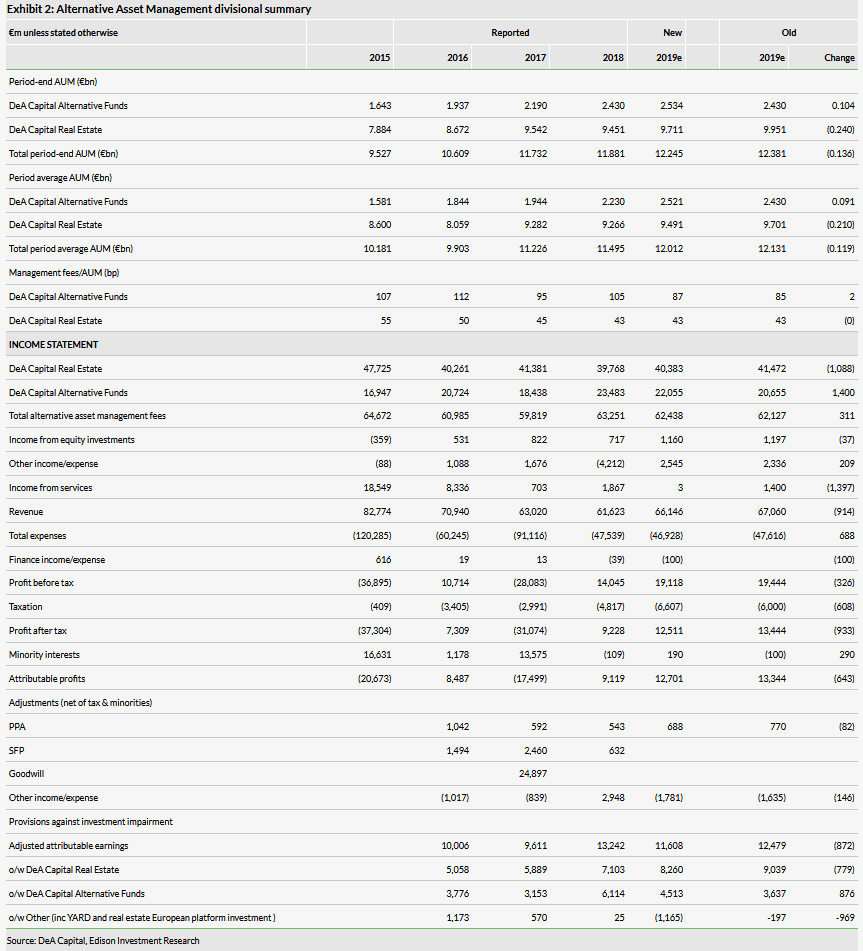
The Q119 performance fee income was not included in our forecasts and represents a positive development. Despite this, and also our expectation of growth in AUM, we have reduced our FY19 AAM division adjusted earnings forecast by approximately 7% of c €0.9m, substantially reflecting:
Investment in the pan-European real estate platform development, likely to be c €2.5–3.0m in FY19 with no immediate revenue benefit. In Exhibit 2 this is reflected in the ‘other’ segment loss of c €1.2m, with investment costs partly offset by other activities including 45%-owned associate YARD, which provides property services to the real estate sector.
The deconsolidation of SPC.
A reduction in assumed underlying (excluding performance fee) asset management revenue margins reflecting recent performance.
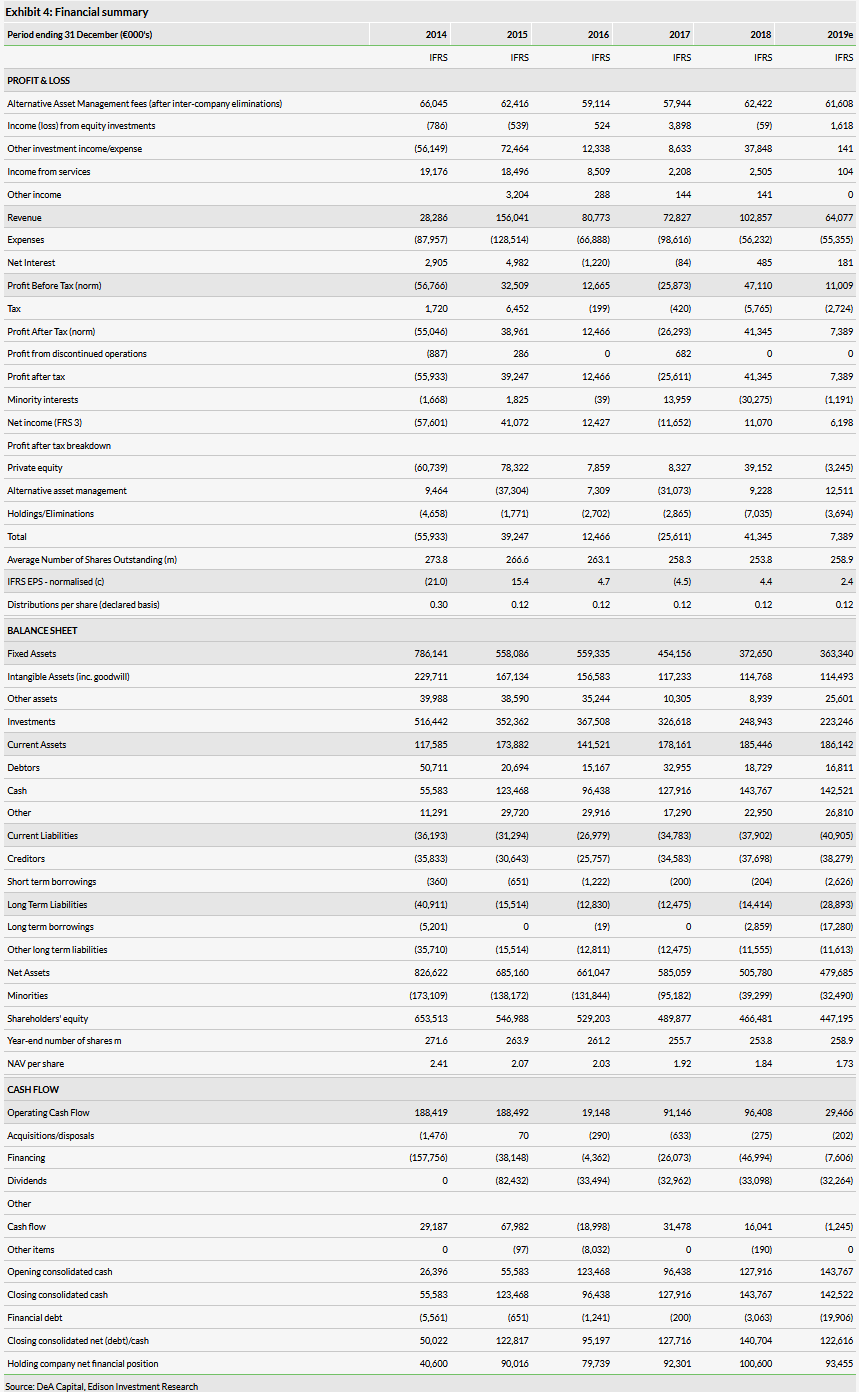
The revised Edison adjusted AAM net income after tax and minorities for FY19 is now €11.6m compared with €12.5m previously.
Other group
As previously, in addition to our estimates for the AAM profit contribution, our NAV forecasts seek to capture at least part of the potential for growth in NAV from the majority of the investment portfolio that is not captured in the AAM segment. This includes the private equity fund holdings and the direct investments (Kenan Investments/Migros, Crescita/Cellularline and IDeaMI). We assume 7.5% per year ‘normalised’ growth in the carried value of all of the private equity fund investments and 4% per year for real estate funds (substantially representing the expected income returns), whether carried as available for sale investments, consolidated or equity accounted. We believe this is a useful way to capture at least some of the returns that may be earned on these investments, even though our approach differs from the way these assets are actually managed, seeking to maximise IRR. Our forecasts assume no change to the last published value of (or income from) the quoted investments, Migros (Kenan Investments), Cellularline (formerly Crescita) and IDeaMI, although for valuation purposes our adjusted NAV (see below) does mark these to market values.
On this basis, our forecast FY19 IFRS NAV per share is now €1.73 compared with €1.77 previously. We also forecast a continuing strong holding company net financial balance of more than €90m including the May payment of c €30m in shareholder distributions. Although net flows from funds were modest in Q119 we allow for a pick up for the year as a whole, generating a net positive c €20m in cash.
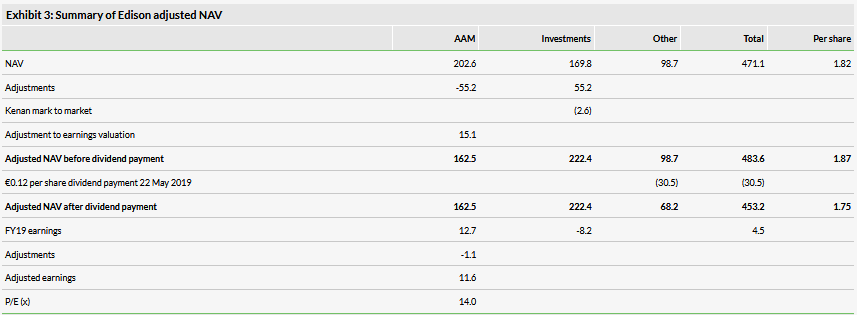
Edison adjusted NAV per share now €1.75 (ex-dividend)
Our adjusted NAV replaces the stated book value of the alternative asset management platform with our assessment of a fair value based on P/E multiples observed across a global peer group of both alternative and more conventional asset management companies. We also mark to market DeA’s quoted investments. For a detailed explanation of our methodology and the peer group, please see our December 2018 update note.
In the AAM division, from the stated NAV of €202.6m we have reallocated the real estate funds owned (with a reduced adjustment for minority interests still applicable at year end) to what we call the ‘investments’ division. We value the division at €162.2m on an increased multiple of 14.0x our forecast FY19 adjusted earnings of €11.6m. We have increased the multiple from 13.0x to better recognise the near-term drag of pan-European real estate investment and the potential for accelerated future growth, and to bring the multiple more in line with the updated peer group average. An increase or reduction in the multiple to 15.0x/13.0x would lift or reduce adjusted NAV by c €0.04.
The ‘investments’ shown in Exhibit 3 include the €169.8m of direct and fund investments shown in the breakdown of NAV in Exhibit 1, plus the reallocated real estate funds. We have also marked to market the indirect investment in Migros held through Kenan Holdings using a Migros share price of TRY11.99 and a TRY/€ exchange rate of 6.72. Both the Migros share price and the value of the TRY are lower than at end-Q119. The market values of Cellularline and IDeaMI show no significant change from end-Q119.
The ‘other’ column represents the holding company net financial position (predominantly cash) and other net assets, shown in Exhibit 1.
