
CommScope Holding Company, Inc. (NASDAQ:COMM) reported solid third-quarter 2019 results with healthy year-over-year increase in revenues and non-GAAP earnings. Results reflected the underlying strength of its resilient business model and diligent execution of operational plans despite a challenging macroeconomic environment and near-term industry headwinds. Post earnings release, shares were up 27.2% to close at $14.94 yesterday.
Bottom Line
On a GAAP basis, net loss for the September quarter was $170.3 million or loss of 88 cents per share against net income of $63.8 million or 33 cents per share in the year-ago quarter. The sharp deterioration was mainly due to substantial operating loss incurred in the quarter and higher interest expenses.
However, non-GAAP net income came in at $126.9 million or 55 cents per share compared with $114.5 million or 59 cents per share in the prior-year quarter. The bottom line beat the Zacks Consensus Estimate by 10 cents.
CommScope Holding Company, Inc. Price, Consensus and EPS Surprise
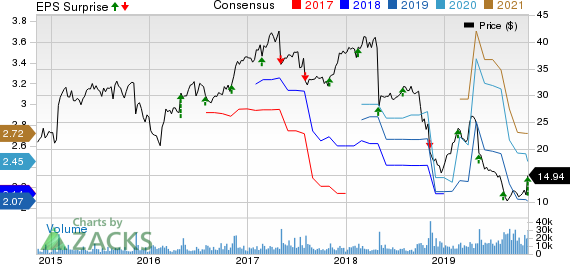
CommScope Holding Company, Inc. price-consensus-eps-surprise-chart | CommScope Holding Company, Inc. Quote
Revenues
Quarterly net sales surged 106.9% year over year to $2,380.2 million, primarily driven by incremental contribution of $1.34 billion from ARRIS and strong performance across all regions. The top line, however, lagged the consensus estimate of $2,428 million.
On a pro forma basis, net sales declined 15% year over year with lower sales in all segments. The decrease was mainly due to lower sales to cable operator customers, pricing pressures and negative impact of about 1% from foreign exchange rate changes.
Segment Results
Net pro forma sales from Connectivity Solutions were down 13.3% year over year to $634.5 million due to lower sales volume and adverse foreign currency translation. GAAP operating income declined 41.9% to $55.1 million owing to lower sales volume.
Net pro forma sales from Mobility Solutions totaled $405.9 million, down 3.1% year over year, led by the pending merger of T-Mobile US, Inc. (NYSE:S) and Sprint Corporation (NYSE:S) . Healthy demand, particularly in North America and EMEA (Europe, Middle East and Africa) more than offset decline in the Asia-Pacific region. GAAP operating loss of $2 million (down from operating income of $37.3 million in the year-ago quarter) was due to the settlement of patent infringement litigation.
Net pro forma sales from Customer Premise Equipment came in at $826.4 million, down 12.2% year over year due to lower cable operator spending. While net pro forma sales from Network and Cloud were $376.9 million (down 29.2%), the same from Ruckus equaled $136.5 million (down 23.2%).
Other Details
For the third quarter, gross profit was $609.9 million compared with $409.7 million in the prior-year quarter. Total GAAP operating expenses surged to $660.7 million from $277.5 million, leading to operating loss of $50.8 million against operating income of $132.2 million in the prior-year quarter. Non-GAAP adjusted EBITDA was $369.8 million compared with $237.8 million in the year-earlier quarter.
Cash Flow & Liquidity
During the first nine months of 2019, CommScope generated $260.4 million of net cash from operations compared with $361.9 million in the year-ago period. As of Sep 30, 2019, the wireless and broadband network technology company had $609.1 million in cash and cash equivalents with $10,101.2 million of long-term debt.
Q4 Outlook
For the fourth quarter, CommScope expects revenues between $2.2 billion and $2.4 billion. Non-GAAP adjusted EBITDA is anticipated to be within $275-$335 million. It estimates loss per share of 45-42 cents, while non-GAAP earnings is expected to be in the range of 27-37 cents per share.
Zacks Rank & Stock to Consider
CommScope currently has a Zacks Rank #3 (Hold).
A better-ranked stock in the broader industry is ATN International, Inc. (NASDAQ:ATNI) , carrying a Zacks Rank #2 (Buy). You can see the complete list of today’s Zacks Rank #1 (Strong Buy) stocks here.
ATN International delivered an average positive earnings surprise of 143.9% in the trailing four quarters.
Today's Best Stocks from Zacks
Would you like to see the updated picks from our best market-beating strategies? From 2017 through 2018, while the S&P 500 gained +15.8%, five of our screens returned +38.0%, +61.3%, +61.6%, +68.1%, and +98.3%.
This outperformance has not just been a recent phenomenon. From 2000 – 2018, while the S&P averaged +4.8% per year, our top strategies averaged up to +56.2% per year.
See their latest picks free >>
CommScope Holding Company, Inc. (COMM): Free Stock Analysis Report
Sprint Corporation (S): Free Stock Analysis Report
ATN International, Inc. (ATNI): Free Stock Analysis Report
T-Mobile US, Inc. (TMUS): Free Stock Analysis Report
Original post
Zacks Investment Research