Gold (GLD) has been in the dumper. Ever since it broke below 1550 it has had some big legs down and then a slow grinding recovery before it starts down again. Is it over now? I don’t know.
And what about Crude Oil (USO)? It has had its own ups and downs. Currently it is on the verge of a beakout higher.
The problem, of course, is that both have been highly volatile. That's great news if you are a day trader, but for a swing trader it simply leads to chop.
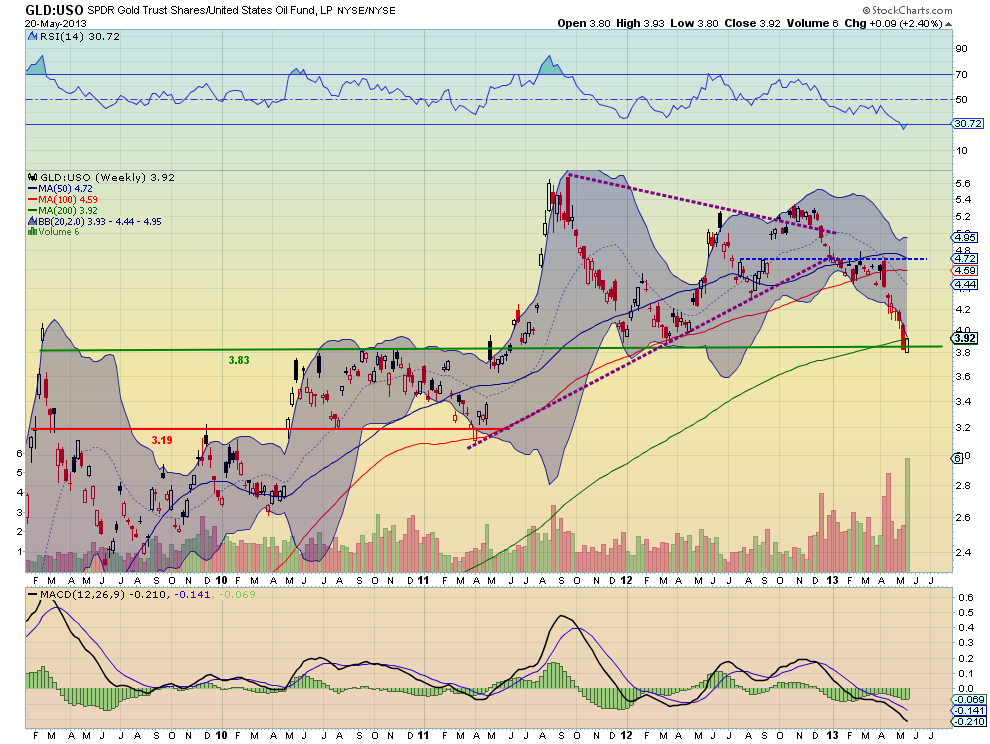
So how do you decide whether to choose yellow or black Gold? One way to deal with it is to look at things in pairs. The ratio of GLD to USO, for example, has behaved in a much more civilized manner. The weekly chart below shows the failed break out of a two year symmetrical triangle before it fell to the downside. It is now pursuing the target to 2.20. Along the way it sits in a position that makes it interesting for a potential trade.
At the 3.83 ratio, which has been important for over 4 years, the major resistance and support levels are quite far away in either direction. Watch for the reaction to the green line.
A hold and reverse has smooth sailing up to a ratio of 4.44 or 4.70. A continued breakdown sees support next at 3.19 and then 2.61. The picture favors the downside, with Gold giving up more ground to Oil, but be prepared. In rough terms, 400 shares long (short) of USO for every 100 shares short (long) of GLD on a move higher (or lower) in the ratio could yield a dandy return.
Disclosure: The information in this blog post represents my own opinions and does not contain a recommendation for any particular security or investment. I or my affiliates may hold positions or other interests in securities mentioned in the Blog, please see my Disclaimer page for my full disclaimer.
Original post
- English (UK)
- English (India)
- English (Canada)
- English (Australia)
- English (South Africa)
- English (Philippines)
- English (Nigeria)
- Deutsch
- Español (España)
- Español (México)
- Français
- Italiano
- Nederlands
- Português (Portugal)
- Polski
- Português (Brasil)
- Русский
- Türkçe
- العربية
- Ελληνικά
- Svenska
- Suomi
- עברית
- 日本語
- 한국어
- 简体中文
- 繁體中文
- Bahasa Indonesia
- Bahasa Melayu
- ไทย
- Tiếng Việt
- हिंदी
Commodity Face-Off: Checking The Gold To Oil Ratio
Published 05/21/2013, 08:14 AM
Updated 05/14/2017, 06:45 AM
Commodity Face-Off: Checking The Gold To Oil Ratio
Latest comments
Loading next article…
Install Our App
Risk Disclosure: Trading in financial instruments and/or cryptocurrencies involves high risks including the risk of losing some, or all, of your investment amount, and may not be suitable for all investors. Prices of cryptocurrencies are extremely volatile and may be affected by external factors such as financial, regulatory or political events. Trading on margin increases the financial risks.
Before deciding to trade in financial instrument or cryptocurrencies you should be fully informed of the risks and costs associated with trading the financial markets, carefully consider your investment objectives, level of experience, and risk appetite, and seek professional advice where needed.
Fusion Media would like to remind you that the data contained in this website is not necessarily real-time nor accurate. The data and prices on the website are not necessarily provided by any market or exchange, but may be provided by market makers, and so prices may not be accurate and may differ from the actual price at any given market, meaning prices are indicative and not appropriate for trading purposes. Fusion Media and any provider of the data contained in this website will not accept liability for any loss or damage as a result of your trading, or your reliance on the information contained within this website.
It is prohibited to use, store, reproduce, display, modify, transmit or distribute the data contained in this website without the explicit prior written permission of Fusion Media and/or the data provider. All intellectual property rights are reserved by the providers and/or the exchange providing the data contained in this website.
Fusion Media may be compensated by the advertisers that appear on the website, based on your interaction with the advertisements or advertisers.
© 2007-2024 - Fusion Media Limited. All Rights Reserved.
