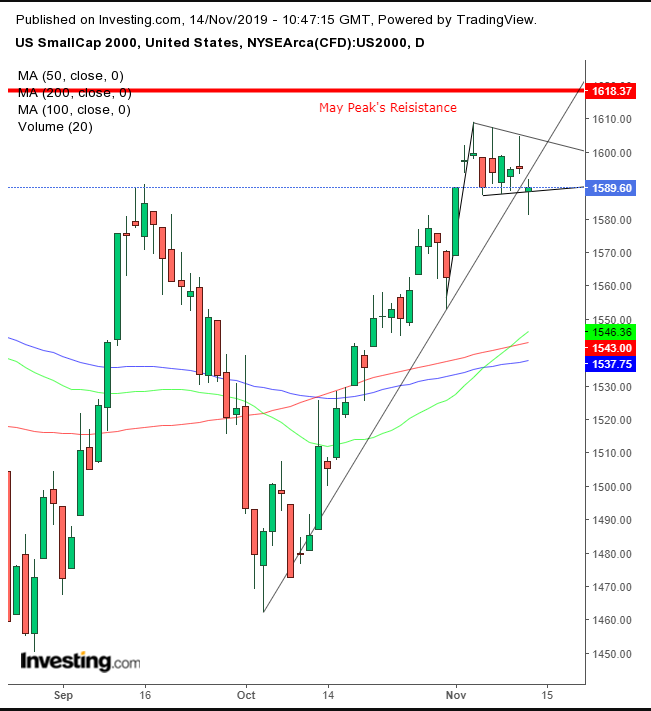
Small caps have been underperforming, both in value and from a technical perspective. This may be telling us something crucial about the broader market's future outlook.
Some analysts are excited about the Russell 2000's recent golden cross, when the 50 DMA crossed above the 200 DMA. That technical trigger is generally considered bullish. However, considering that the gauge has been trendless all year, during which time the 50 DMA climbed above as well as fell below the 200 DMA, we can’t rely on a trend-tracking indicator such as MAs.
The fact is that the Russell 2000 has been the worst performer among the main U.S. indices since the dramatic December selloff and subsequent recovery. The Russell is up 17.87% since the Christmas Eve bottom — lower than the Dow's 19.1%, the S&P 500's 23.43% and the Nasdaq's 27.83%.
Additionally, it is the only main index that hasn’t hit record highs, demonstrating relative weakness since last year’s selloffs. This weakness is especially poignant considering that small caps outperformed for much of last year as a defensive measure against large caps that rely on tariffs.
From a technical perspective, small cap weakness amid a market top is a red flag. Typically, investors unload more speculative stocks when they get worried about the economy, before they dump the safer midcaps and large caps.
The question is whether the current small cap weakness is indicative of a broader market top. Short answer, we don’t know. However, the supply-demand balance provides some warning signs.

The index has been consolidating since its Nov. 5 high within a pennant shaped pattern. After the 3.5% jump in just the four days preceding the range, from the Oct. 31 bottom to the Nov. 5 top, the emerging pattern provided a bullish indicator, especially considering the near 10% advance since the Oct. 3 bottom.
The fact that the pennant developed 0.5% below the May 6 high further increased a bullish setup within the technical map, as old bulls cashed out, letting young bulls in for the next climb and taking on the bears at the technical resistance.
However, yesterday the price slipped below the pattern and just made it back in — emphasizing the resistance of the Gravestone Doji that developed on Nov. 5, at the start of the pattern. While the index managed to crawl back into the pennant, it fell below the uptrend line since the Oct. 3 bottom for the first time.
That is not necessarily bearish, as prices often deviate from up and down trend lines while developing a pattern. Investors focus on current conditions at the expense of a more remote dynamic. However, when considering the underperformance in value and in the technicals, at a broad market top, no less, investors may be extra cautious.
Trading Strategies – Short Position Setup
Conservative traders would wait for the uptrend to break the May high for a long position or to fall below the Aug. 28 low at 1,450, topping out, for a short position.
Moderate traders may wait to act on the pennant breakout, in either direction, employing at least a 2% filter to avoid a trap.
Aggressive traders may be content with a 1% pattern penetration.
Trade Sample
