Personally I love junk bonds. Yields greater than typical bonds and a high correlation to the stock market is not a bad combination – typically. In fact, this combination can generate some outstanding returns as long as the stock market does anything but crater.
But there is a time and a place for everything.
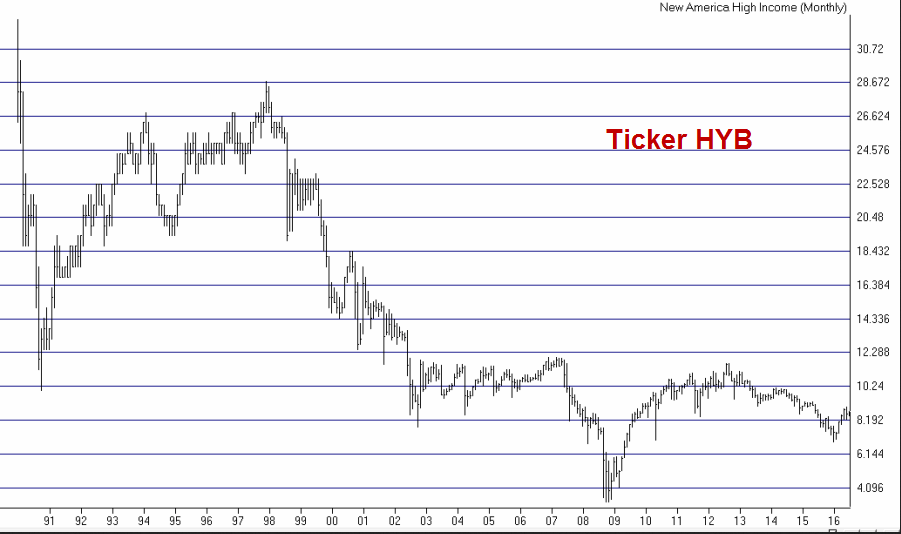
Ticker HYB is the New America High Income closed-end fund. Its portfolio can reasonably be described as “very junky”, which is why it sports a current yield of roughly 10%. That's a very enticing yield indeed. Figure 1 displays the monthly price chart since inception of trading in 1990.

Figure 1
HYB has certainly had its ups and downs, but it recently rose 30% from its January lows. Interestingly, one would probably not guess from a glance at Figure 1 that this fund – and the junk-bond sector in general – is highly cyclical in nature.
The Test
For the test, we're using price data only and no dividends are included. Clearly dividend income plays a big part in the total return for this fund, but our goal here is simply to isolate the cyclical nature of junk-bond price action.
Trading Rules
- Buy HYB at the close of the 11th trading day of December
- Sell HYB at the close on the 5th trading day of June
The Results
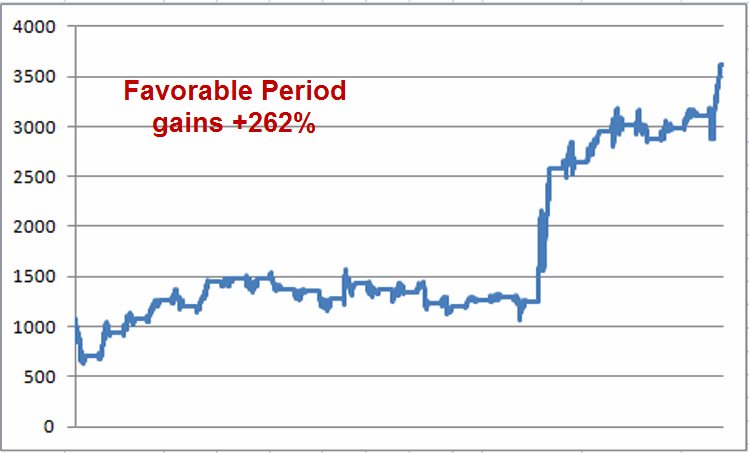
Figure 2 displays the growth of $1,000 invested in HYB only between the 11th trading day of December and the 5th trading day of June from 1/2/1990 to 7/8/2016.

Figure 2 – Growth of $1,000 invested in ticker HYB ONLY during favorable seasonal period; 1/2/90-7/8/16
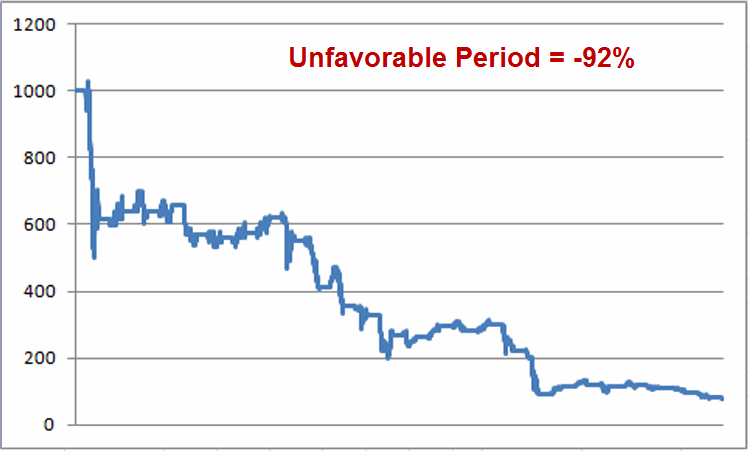
Figure 3 displays the growth of $1,000 invested in HYB only between the 5th trading day of June and the 11th day of December.

Figure 3 – Growth of $1,000 invested in ticker HYB ONLY during unfavorable seasonal period; 1/2/90-7/8/16
For The Record
- The “favorable” period showed HYB generating a net (price only) gain of +262%.
- The “unfavorable” period showed HYB generating a net (price only) loss of -92%.
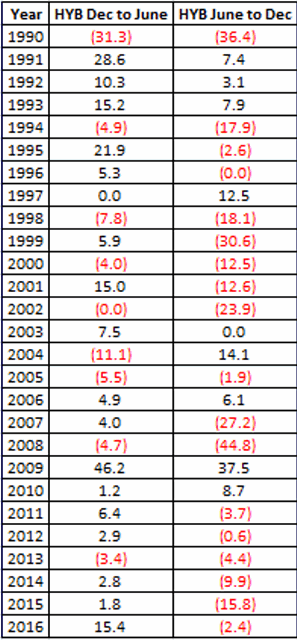
Figure 4 displays the year-by-year results for HYB price action during the “favorable” and “unfavorable” periods.

Figure 4 – HYB price only performance Dec into June versus June into Dec.
It should be noted that during the June to December “unfavorable” period HYB has showed a price gain 9 times in the past 26 years. So it should not be assumed that a price decline between now and December is assured. Also consider that the last 5 “unfavorable” periods have seen a decline. So we should not be surprised if an advance occurs this time around, particularly if the stock market does manage to break out to the upside and run.
Still, the line in Figure 3 and the numbers in the right hand column in Figure 4 should give us “junk-bond lovers” pause.
Summary
Do the numbers above guarantee that high-yield bonds (and funds) are headed lower between now and mid-December? Not at all. Can you make money in junk bonds in the months ahead? Absolutely. If the stock market moves to the upside junk bonds will likely follow. Add in an already high yield and there is the “potential” for meaningful gains.
Just remember that history suggests otherwise, so don’t bet the ranch.
