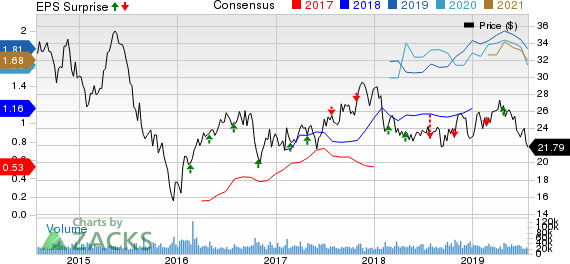
Cabot Oil & Gas Corporation (NYSE:COG) reported second-quarter 2019 earnings per share — adjusted for special items — of 36 cents, surpassing the Zacks Consensus Estimate of 33 cents and the year-ago figure of 13 cents.
The strong results can be attributed to lower costs and slightly higher-than-anticipated production. Precisely, the company’s production came in at 213.8 billion cubic feet equivalent (Bcfe), just ahead of the Zacks Consensus Estimate of 213 Bcfe.
The company’s quarterly revenues of $534.1 million outpaced the Zacks Consensus Estimate of $491 million. Further, the reported figure was above the prior-year quarter’s revenues of $453.4 million.
In more good news for investors, the natural gas explorer said that it is expanding its share-buyback program by 25 million shares.
Production, Prices, Costs & Drilling Statistics
In the quarter under review, Cabot’s overall production totaled 213.8 Bcfe – 100% natural gas – 24% higher than the prior-year quarter volume of 172.4 Bcfe.
Average realized natural gas price (excluding hedges) rose to $2.20 per thousand cubic feet from the year-ago quarter’s $2.11. The Zacks Consensus Estimate called for a price of $2.19 per thousand cubic feet.
Total operating expenses were 23.7% lower than the second quarter of 2018, decreasing to $287 million. While transportation and gathering costs were up 24.1% year over year to $141.7 million, Cabot did not incur any operating expense in brokered natural gas activity for which it shelled out $80.1 million in the year-ago period.
Notably, total average unit costs declined to $1.41 per thousand cubic feet equivalent (Mcfe) from the year-ago figure of $1.85.
Cabot drilled 24 wells and completed 28 during the quarter.
Financial Position
Operating cash flows were $326.7 million (up 19.3% year over year), while capital expenditures totaled $225.9 million (down 2.2%). Free cash flow (FCF) — which is a key metric to gauge a company’s financial health — was $72.7 million during the second quarter, turning around from a negative $62 million a year ago. As of Jun 30, 2019, the company had cash and cash equivalents of $241.4 million and total debt of $1.2 billion, with a debt-to-capitalization ratio of 34.2%.
Share Repurchase Program
Through the second quarter, the company bought back 5.1 million shares at a weighted average share price of $24.63.
Guidance
For the third quarter, Cabot provided its net production guidance in the range of 2,360-2,410 million cubic feet equivalent a day. Meanwhile, the company adjusted its full-year production growth guidance to a range of 16 to 18%, down from the previous projection of 20%. The downward revision was attributed to a change in operating plan that will push out some production to late December or early January.
Finally, Cabot raised its full-year capital expenditure projection to $800-$820 million, as against $800 previously. The uptick reflects incremental drilling and completion activity.
Zacks Rank & Key Picks
Cabot Oil & Gas holds a Zacks Rank #3 (Hold).
Some better-ranked players in the energy space are Canadian Natural Resources Limited (TSX:CNQ) , Helix Energy Solutions Group, Inc. (NYSE:HLX) and Cheniere Energy, Inc. (NYSE:LNG) . All the companies carry a Zacks Rank #2 (Buy).
You can see the complete list of today’s Zacks #1 Rank (Strong Buy) stocks here.
Over 30 days, the Calgary-based Canadian Natural Resources has seen the Zacks Consensus Estimate for 2019 and 2020 increase 5.4% and 6.6%, to $2.35 and $2.09 per share, respectively.
The 2019 Zacks Consensus Estimate for Houston, TX-based Helix Energy Solutions Group is 30 cents, representing some 57.9% earnings per share growth over 2018. Next year’s average forecast is 39 cents pointing to another 27.8% growth.
Cheniere Energy’s expected EPS growth rate for three to five years currently stands at 31.1%, comparing favorably with the industry’s growth rate of 14.7%.
Biggest Tech Breakthrough in a Generation
Be among the early investors in the new type of device that experts say could impact society as much as the discovery of electricity. Current technology will soon be outdated and replaced by these new devices. In the process, it’s expected to create 22 million jobs and generate $12.3 trillion in activity.
A select few stocks could skyrocket the most as rollout accelerates for this new tech. Early investors could see gains similar to buying Microsoft (NASDAQ:MSFT) in the 1990s. Zacks’ just-released special report reveals 7 stocks to watch. The report is only available for a limited time.
See 7 breakthrough stocks now>>
Canadian Natural Resources Limited (CNQ): Free Stock Analysis Report
Helix Energy Solutions Group, Inc. (HLX): Free Stock Analysis Report
Cabot Oil & Gas Corporation (COG): Free Stock Analysis Report
Cheniere Energy, Inc. (LNG): Free Stock Analysis Report
Original post
Zacks Investment Research

