
On March 19, 2019, BeInCrypto published a review of the Binance exchange to compliment our regular analysis of Binance Coin (BNB).
On Mar 7, 2019, the price of Binance Coin reached a high of nearly $16. A sharp drop followed. BNB has been on a gradual uptrend since. It made another high above $16 on Mar 17.
Here is the market outlook from Mar 7 to Mar 20: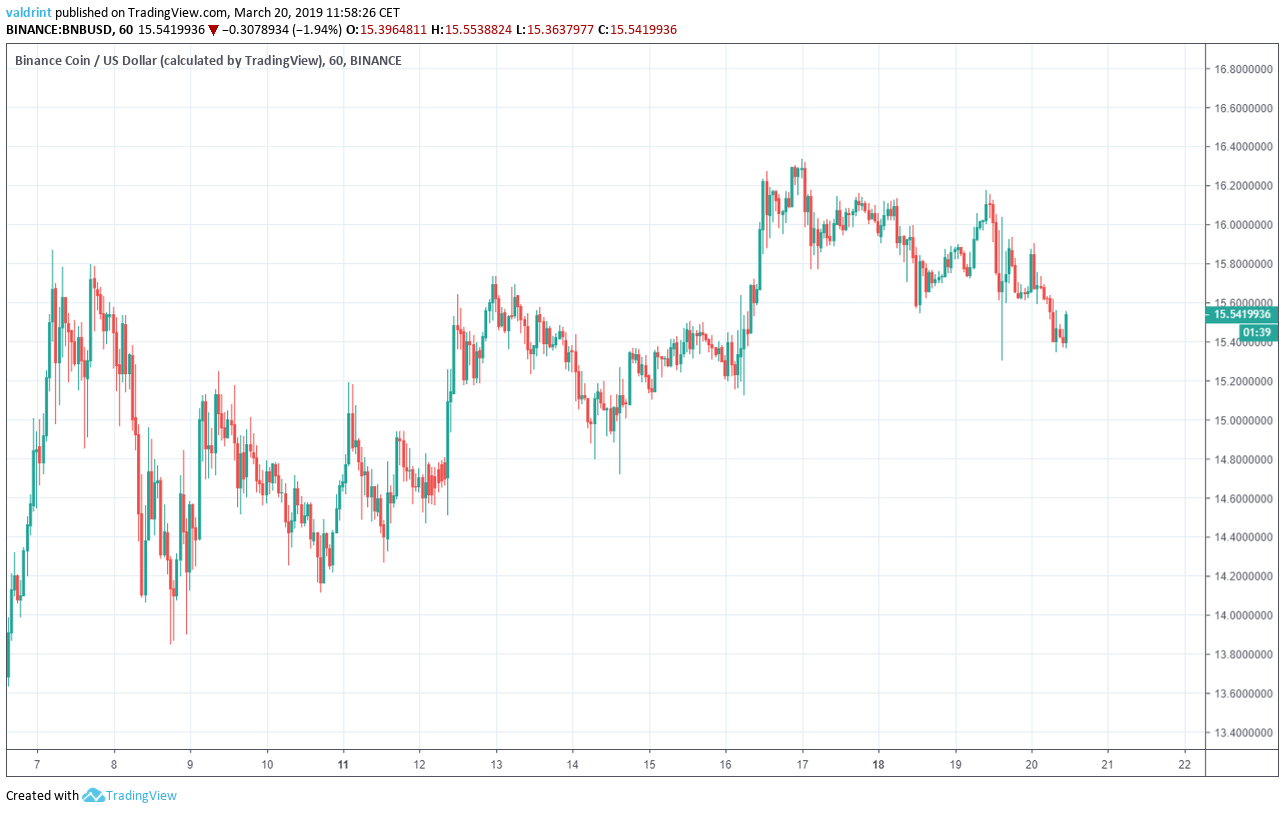
In our Mar 15 analysis of Binance Coin, we predicted that the price is likely to experience slow growth before making an upward move. The prediction was validated on Mar 16.
Based on today’s analysis, further price decreases are to be expected in the future.
BNB: Trends and Highlights for March 20, 2019
- The price of Binance Coin has been on a gradual uptrend since Mar 8.
- It recently broke down from an ascending wedge.
- The breakdown was preceded by a sell signal created by the MACD and SMAs.
- There is resistance near $17.
- There are support areas near $14.50 and $11.
Ascending Support
The price of BNB on Binance is analyzed at one-hour intervals from Mar 7 to Mar 20.
The price made a low of $13.84 on Mar 8. Since, it has been on a gradual uptrend, completing several market cycles. Each low has been higher than the previous one. Tracing these lows gives us an ascending support line.
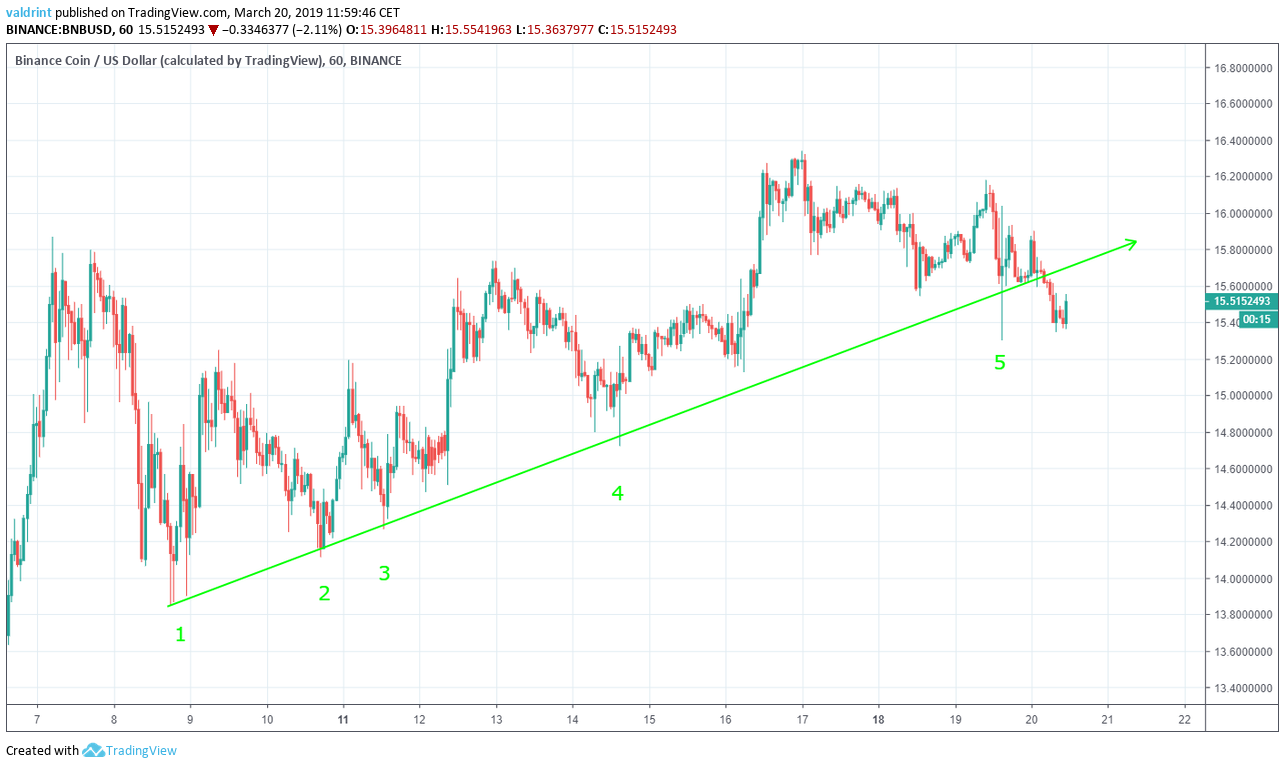
The support line acts as a floor to price, preventing further downward movement. It traces the theoretical lower limits of the price and measures an asset’s rate of growth.
It is likely that the price increases at the same rate as predicted by the line. However, breakdowns below the support can signify forthcoming price decreases.
Binance Coin experienced a breakdown on Mar 20. At the time of writing, BNB’s value was trading below support.
Unless a reversal brings BNB back above support, prices are likely to continue decreasing. This will likely generate a new support line.
Ascending Wedge
The price of BNB made a high of $15.86 on Mar 7. A rapid drop ensued followed by a gradual rise.
The price has made higher highs during this rise—culminating at $16.33 on Mar 17. Tracing these highs gives us an ascending resistance line.
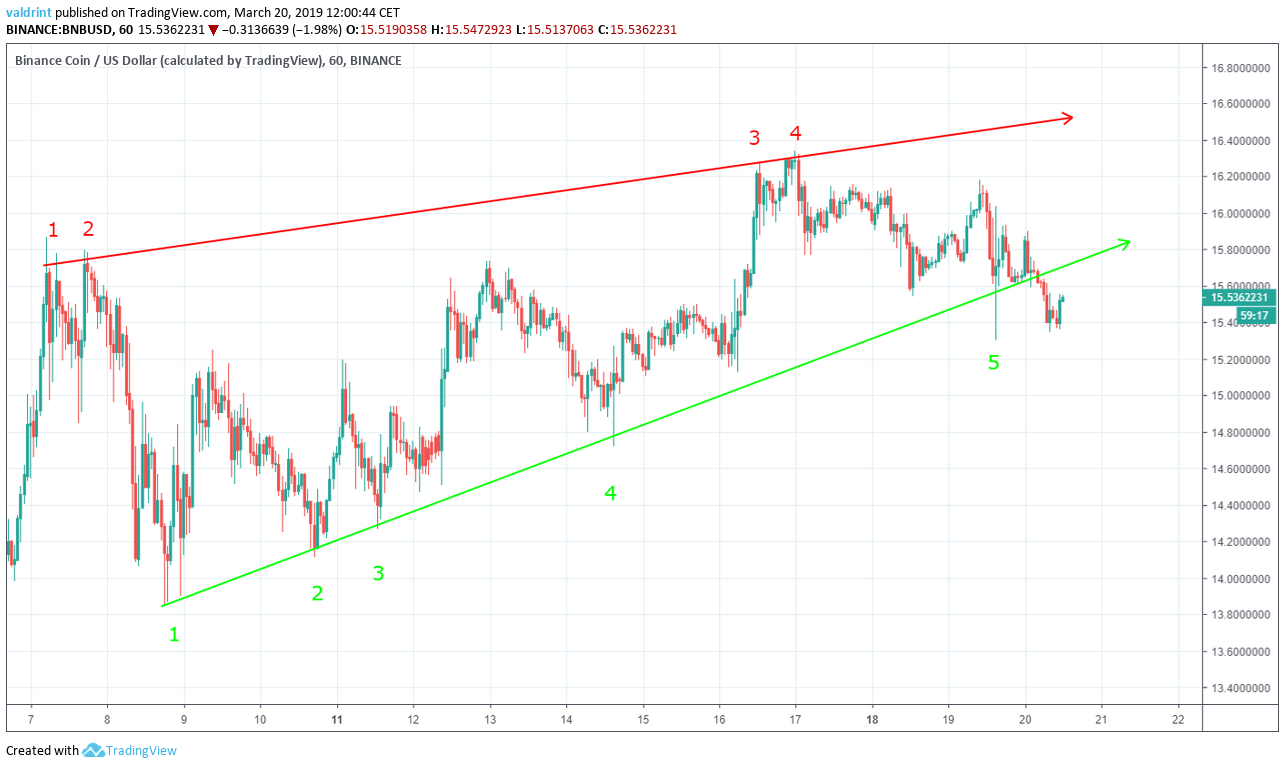
Similar to the support line, the horizontal line acts as a ceiling to price, preventing further upward movement.
The support and resistance lines combine to create an ascending wedge, which is a bearish pattern, making price decreases more likely.
It is likely that the resistance line is not reached again in the near future. Furthermore, if prices stabilize below support, new resistance is likely to emerge. Together, new support and resistance lines would generate a new trading pattern.
Signal Triggered
The moving average convergence divergence (MACD) is a trend indicator that shows the relationship between two moving averages (long and short-term) and the price. It is used to measure the strength of a move.
Combined with simple moving averages (SMA), MACD can be used as a trigger for buy and sell signals. Signals are triggered whenever the MACD line is above 0 and the price is above the 21 (red) and 50-period (green) SMAs.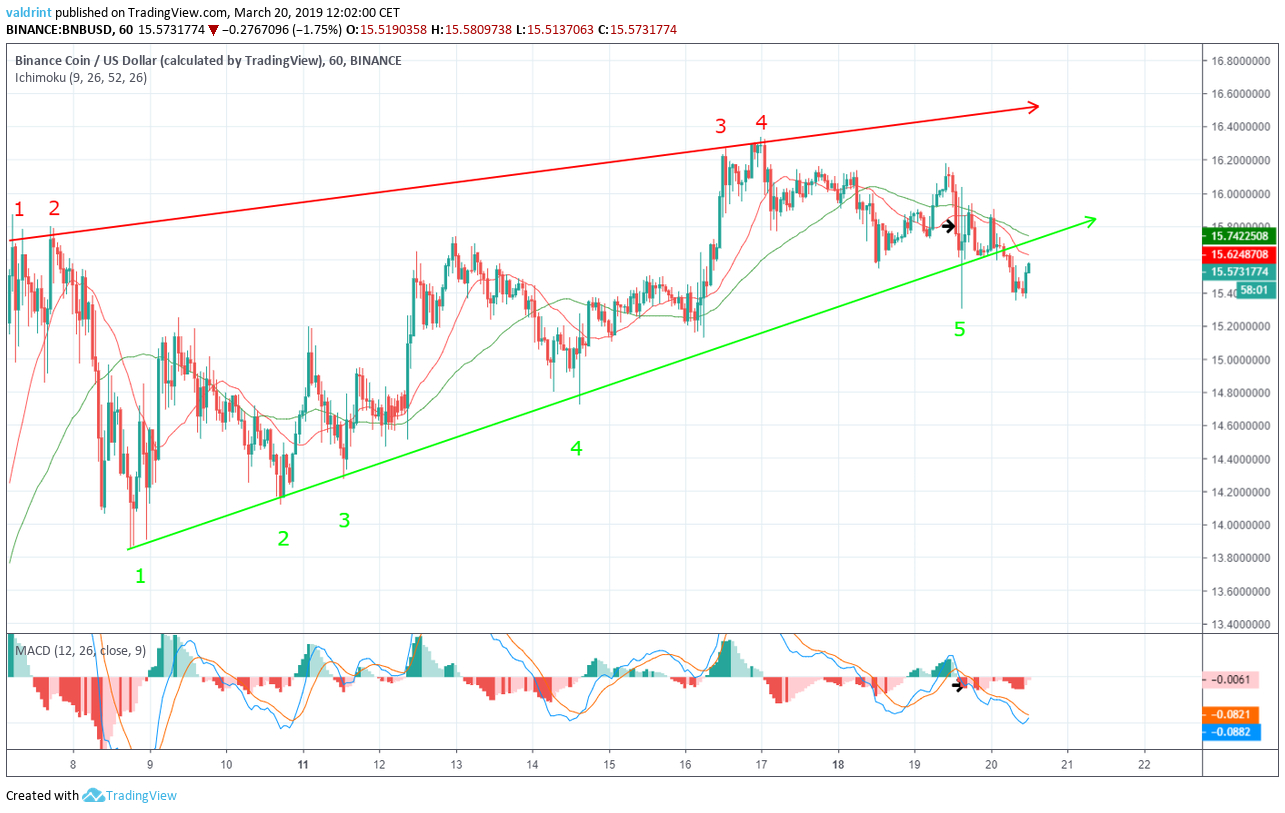
On Mar 19, the price initiated a downward move which took it below the 21 and 50-period moving averages.
During the same interval, the MACD line crossed below 0. This would have triggered a sell signal—indicating that the current trend may be over and a new downtrend may begin. The breaktdown on Mar 20 suggest that downtrend may have already begun.
The signal preceded the breakdown by 14 hours.
Using these indicators, it is likely that the downtrend will continue until new resistance and support areas are created.
Future Movements
The price of BNB on Binance is analyzed at 12-hour intervals from Jun 1, 2018 to Mar 15, 2019 in order to better visualize possible reversal areas.
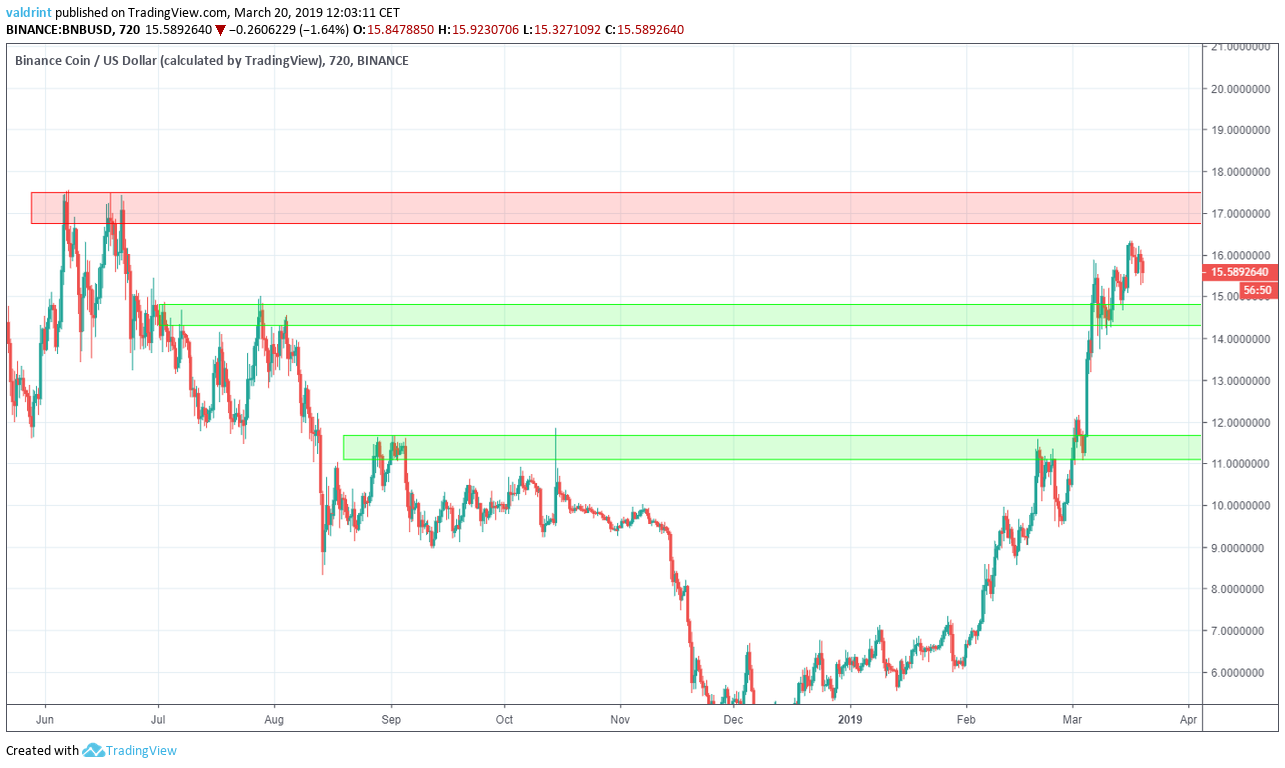
Resistance and support lines are created when the price visits the same level several times and are helpful in locating potential reversal areas.
The first resistance area is found near $17, created by the Jun 2018 highs. Based on our analysis, it is unlikely that the prices will reach this area in the near future.
The first support area is found near between $14 and $15, while the second one is found near $11. Based on our analysis, it is likely that the price will reach at least one of these areas. Drops to $11 may be possible given both rapid and gradual price increases seen over the last several weeks.
Summary of Analysis
Based on this analysis, the price is likely to continue dropping until it creates new resistance and support areas. If it keeps dropping, the prediction will be partially validated. If it initially increases to touch the support line then falls, it will be fully validated. A breakout above the resistance line would invalidate our prediction.
Disclaimer: This article is not trading advice and should not be construed as such. Always consult a trained financial professional before investing in cryptocurrencies, as the market is particularly volatile.