Those who have followed our blog for some time now know that we are big proponents of technical analysis in reading the trends of the market. This type of examination can also be applied when we are analyzing individual sectors or industries that have diverged from the conventional path of the market.
Last year’s big diverging theme was energy stocks as noted by the -21.50% decline in the Energy Select Sector SPDR (NYSE:XLE)) versus relatively flat performance in the broad-based SPDR S&P 500 ETF (NYSE:SPY).
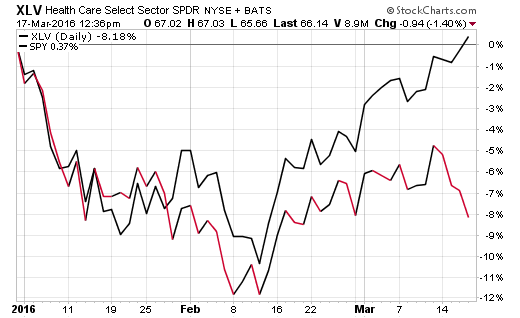
This year, the weakest sector has been health care stocks. The Health Care Select Sector SPDR (NYSE:XLV) is still down over 8% as SPY begins to peak its head above the flat line.

The biggest contributor to this decline in health care has been the biotechnology industry. The iShares Nasdaq Biotechnology (NASDAQ:IBB) has over $5.7 billion dedicated to a market-cap weighted index of 190 biotech companies. Top holdings include large-cap stocks: Celgene Corp (NASDAQ:CELG), Amgen Inc (NASDAQ:AMGN), and Biogen Inc (NASDAQ:BIIB).
There are a plethora of biotech ETFs available in varying styles, weights, and construction methodologies. However, IBB is the largest and most watched index of them all because of its tenure and skew towards the largest companies in this group.
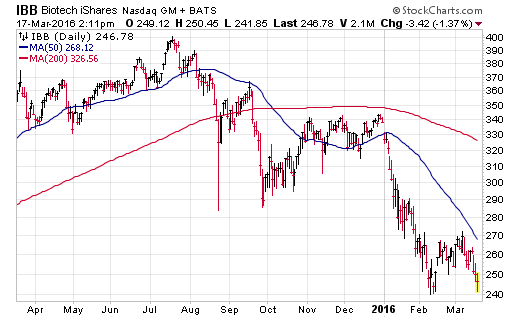
The chart below shows that this ETF recently touched a critical level near $240 and has started to bounce intra-day. This same level was probed in early February and proved to be a key support line.

It goes without saying that if IBB can mount another rally from these levels, it may be viewed by technicians as a bullish “double bottom” price pattern. I point this out for traders and those with a disciplined investment approach because a breach of those lows could also lead to another wave of selling pressure.
If your style involves watching for turnaround potential using price charts and momentum divergences, then this opportunity should certainly be on your radar. IBB is down -27% on a year-to-date basis and has shown in the past that rallies can materialize quickly.
I don’t currently own any direct sector exposure to a fund like IBB for my growth clients because of the merry-go-round in leadership. It’s difficult to forecast where the next burst of strength will come from at the sector or industry level unless you are betting on short-term moves with tight stop losses.
My current mix of stocks is directed towards broad, low volatility or quality-focused indexes that I believe offer a more stable platform to participate in further upside momentum. This provides me with core, low-cost exposure without worrying about hitting the nail perfectly on the head.
Nevertheless, I always keep a close eye on how specific areas of the market are trading and whether or not a reversal can morph into a new uptrend.
Disclosure: FMD Capital Management, its executives, and/or its clients may hold positions in the ETFs, mutual funds or any investment asset mentioned in this article. The commentary does not constitute individualized investment advice. The opinions offered herein are not personalized recommendations to buy, sell or hold securities.
