
Many traders and investors love to see and find a good breakout pattern on the charts. While such patterns are great, we've got to know when they become parabolic. That's because parabolic charts often signal the time to sell out of the trade.
Parabolic Defined
A parabolic chart is when a stock price rallies sharply higher in a very steep angle on the charts. Often, when a stock surges sharply higher without pulling back, it can only travel so far before the owner of that equity starts to sell out of the position.
Don't Chase Extended Equity
For example, the other day First Solar Inc. (FSLR) soared after reporting better-than-expected guidance. Many short sellers were caught off guard causing a short squeeze in the stock, which rallied higher by $14 on the day from around $27 to $41 intra-day. That type of surge is what we would call a parabolic intra-day move. Now we can only wonder who was buying the stock at $41 after such an enormous intra-day bounce. Some of the buyers were short sellers that had to close out their position while others were likely the misinformed retail traders trying to catch the momentum in the stock. Either way, when you see an equity rally in that type of steep formation, it's unsustainable and the equity will pullback. Today, FSLR stock is trading around the $37 level. The idea here is to make sure that you do not chase the equity when it reaches extended levels. Traders should wait for it to pullback and form a pattern that will signal further upside.
Another good example that occurred recently is the chart on Bitcoin, the virtual currency that has soared recently from under $10 to more than $200. Many investors and traders are asking why the virtual currency sold off so sharply after trading above the $200 level. The reason is the same as any other equity -- it traded in an unsustainable parabolic manner.
In March 2012, the same type of pattern occurred in a stock called Broadvision Inc. (BVSN). This stock surged from $10 a share to $55 in just two months. That type of pattern is again unsustainable and the traders and investors that caught the move are going to sell out of the position at the highs. That stock plunged from a high of $55 a share back down to $10 in just three months.
Watch The Steep Angles
The same parabolic patterns repeat over and over throughout history on all time frames. Traders and investors must simply know that it is not prudent to chase an equity when the chart pattern moves up in a very steep angle. Knowing this pattern should help to keep a lot of novice traders and investors out of buying equities that have already made their momentum move.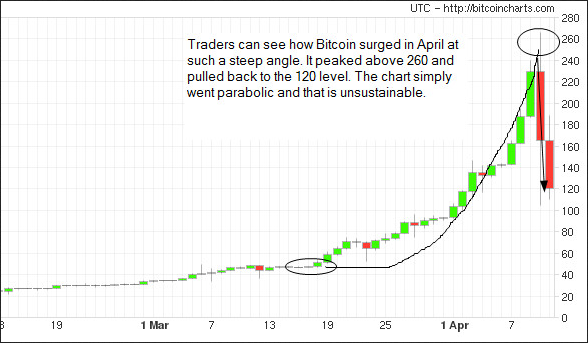
- English (UK)
- English (India)
- English (Canada)
- English (Australia)
- English (South Africa)
- English (Philippines)
- English (Nigeria)
- Deutsch
- Español (España)
- Español (México)
- Français
- Italiano
- Nederlands
- Português (Portugal)
- Polski
- Português (Brasil)
- Русский
- Türkçe
- العربية
- Ελληνικά
- Svenska
- Suomi
- עברית
- 日本語
- 한국어
- 简体中文
- 繁體中文
- Bahasa Indonesia
- Bahasa Melayu
- ไทย
- Tiếng Việt
- हिंदी
Beware Of Parabolic Charts
Published 04/11/2013, 11:28 AM
Updated 07/09/2023, 06:31 AM
Beware Of Parabolic Charts
3rd party Ad. Not an offer or recommendation by Investing.com. See disclosure here or
remove ads
.
Latest comments
bitcoin is the only thing going parabolic in hte world right now
Install Our App
Risk Disclosure: Trading in financial instruments and/or cryptocurrencies involves high risks including the risk of losing some, or all, of your investment amount, and may not be suitable for all investors. Prices of cryptocurrencies are extremely volatile and may be affected by external factors such as financial, regulatory or political events. Trading on margin increases the financial risks.
Before deciding to trade in financial instrument or cryptocurrencies you should be fully informed of the risks and costs associated with trading the financial markets, carefully consider your investment objectives, level of experience, and risk appetite, and seek professional advice where needed.
Fusion Media would like to remind you that the data contained in this website is not necessarily real-time nor accurate. The data and prices on the website are not necessarily provided by any market or exchange, but may be provided by market makers, and so prices may not be accurate and may differ from the actual price at any given market, meaning prices are indicative and not appropriate for trading purposes. Fusion Media and any provider of the data contained in this website will not accept liability for any loss or damage as a result of your trading, or your reliance on the information contained within this website.
It is prohibited to use, store, reproduce, display, modify, transmit or distribute the data contained in this website without the explicit prior written permission of Fusion Media and/or the data provider. All intellectual property rights are reserved by the providers and/or the exchange providing the data contained in this website.
Fusion Media may be compensated by the advertisers that appear on the website, based on your interaction with the advertisements or advertisers.
© 2007-2024 - Fusion Media Limited. All Rights Reserved.