How the heck do you fund your retirement today, with regular stocks yielding a pathetic 1.8%?
Today I’m going to show you exactly how—and we’re going to use my favorite tool, closed-end funds (CEFs) to do it. In fact, we’re going to zero in on a particular CEF that’s the poster child for how these high-yielding funds can deliver the retirement you want on a modest nest egg—far less than that million bucks many advisors say you need.
To start, this solid fund pays a steady 6.4% dividend now—nearly four times the payout you’d get from a “regular” stock. Even better for retirees, it pays you that dividend monthly, in line with your bills.
There’s more, too.
CEFs Disprove the Myth That You Can’t Beat the Index
I’ve also picked out this particular fund—the Cohen & Steers Quality Income Realty Fund (NYSE:RQI)—because it dispels one of the biggest myths you’ll hear in investing: that active managers simply can’t beat the market.
But the truth is, CEFs beat their indexes all the time.
RQI, which invests in high-yielding real estate investment trusts (REITs), is the perfect example: it’s handed its shareholders a massive 466% total return in the past decade, the highest of any CEF. RQI nearly doubled the return on the SPDR S&P 500 ETF (NYSE:SPY), in blue below, and more than doubled the return on the SPDR Dow Jones REIT ETF (NYSE:RWR), in red.
Destroying the Indexes
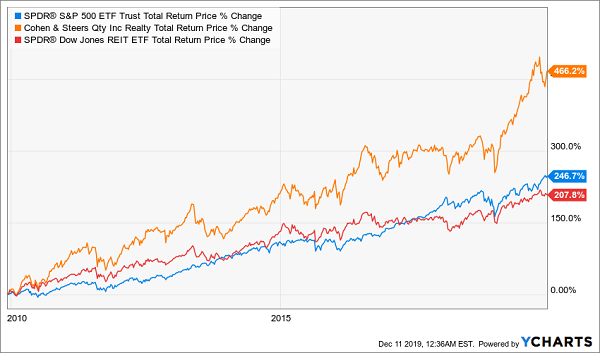
And no, I’m not cherry-picking here. When you go beyond stocks, to high-yield (and too-often-ignored) areas like REITs and preferred stocks, you’ll find that almost all CEFs beat the corresponding index fund.
That’s the first thing I want to get across to you today: if you’re holding a REIT index fund like RWR, you are leaving money on the table—guaranteed.
How a Little-Known Fund Pulled Off a 466% Gain
But exactly how can top-notch CEFs—and RQI in particular—deliver index-beating returns while sustaining monstrous 6.4% income streams? To answer that, we first need to take a deeper dive into the asset class RQI focuses on.
REITs are a kind of tax-advantaged corporation that collects capital from investors and then uses that capital to buy, improve and rent out real estate. There are all kinds of REITs: some specialize in strip malls, others in apartments and others in office space.
Their biggest attraction? High yields! Even if you were to simply buy RWR today, you’d get a 3.3% yield, far ahead of the S&P 500 average.
Those high payouts are the first step in RQI’s strong return.
Step 2? Outperformance: over the long term, REITs simply outrun stocks—by a lot.
REITs Crush Stocks
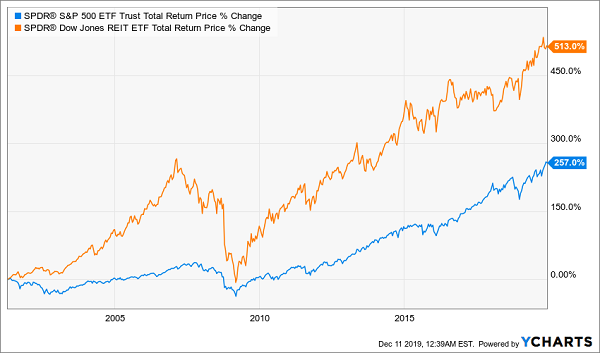
If we go back to the beginning of the 2000s, when the index ETFs were first launched, we see that REITs about doubled the S&P 500’s performance, even taking into account the implosion in real estate that was the 2007—09 Great Recession. That REITs survived this shock and still crushed stocks is a testament to just how powerful this asset class is.
But this isn’t all that’s up RQI’s sleeve.
Top-Notch Management Makes the Difference
As you can tell from its name, RQI is managed by Cohen & Steers, a multi-billion-dollar asset manager based in New York that’s known in financial circles for understanding real estate better than just about everyone else—and it shows in the performance of their funds.
It’s no surprise that RQI and another Cohen & Steers fund, the REIT & Preferred Income Fund (NYSE:RNP), are the best-performing CEFs of the last decade. Cohen & Steers’s other REIT funds are also top performers, and, yes, all of their funds beat their indexes, which again shows you that managed funds are more than capable of outperforming.
And in the case of RQI, the value of savvy management couldn’t be any clearer.
RQI’s Top Picks Soar
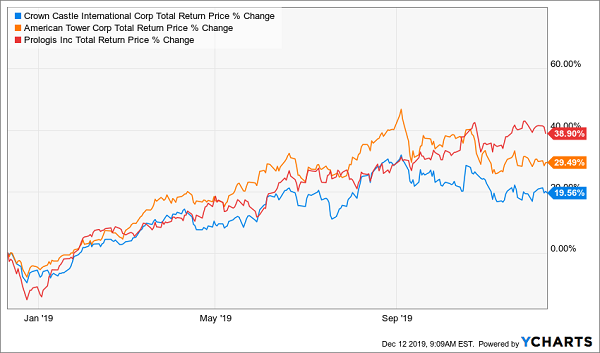
A quick look at RQI’s three biggest holdings—warehouse REIT Prologis (NYSE:PLD), in red above, and cell-tower owners Crown Castle International (NYSE:CCI), in blue, and American Tower (NYSE:AMT), in orange—shows that these picks have averaged a shocking 29.3% return over the last year, while the REIT index has returned 11.4% over the same period. RQI’s net asset value (NAV, or the market value of its overall portfolio) has risen nearly twice as much as the index, thanks to the management team’s careful stock selection:
RQI’s Portfolio Crushes the REIT Sector
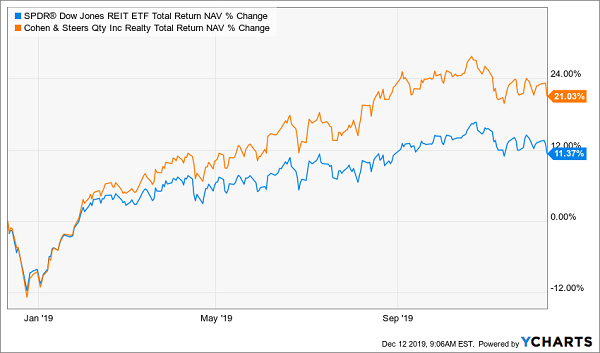
Despite the focus on REITs in both funds, RQI is able to sweep the floor with the index because management knows what REITs to avoid. The index, by definition, cannot, which is why it couldn’t avoid poor-performing REITs.
Duds Pull the Index Down
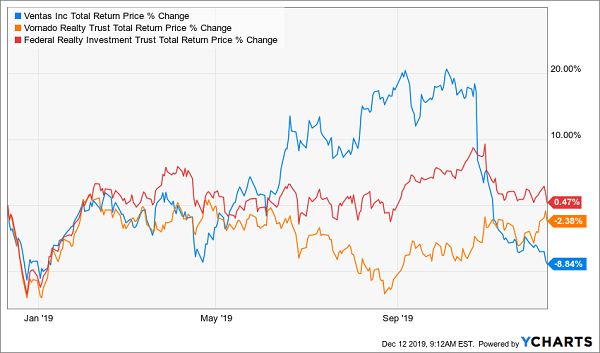
Above, you can see three major components of the REIT index, healthcare landlord Ventas (NYSE:VTR), office REIT Vornado Realty Trust (NYSE:VNO) and shopping mall owner Federal Realty Investment Trust (NYSE:FRT). All three have had an awful 12 months, delivering a negative total return, on average, in a period when stocks and REITs are up double digits.
This kind of lackluster performance from the worst REITs out there is hard to uncover before the fact if you aren’t spending a lot of time analyzing the hundreds of properties each REIT invests in. This is exactly the kind of careful due diligence that’s the backbone of Cohen & Steers’ monstrous gains over the long haul. And it’s why RQI looks set to keep building on its 466% return over the last decade.
My Top 5 Picks Now: 8% Dividends, 20% Upside in 2020
The only problem? As I write this, RQI trades at a slight premium to NAV, meaning that investors are paying just a bit more than the portfolio’s worth.
That’s not a huge problem in and of itself—I still see upside for this very well-managed fund, especially over the long haul. But there’s no doubt that this premium will be a drag on the fund’s gains in 2020. So while RQI deserves a place on your watch list, there’s no compelling reason to jump in right now.
That’s far from the case with 5 other funds I’ve uncovered. Unlike RQI, these new picks trade at ridiculously deep (and totally unusual) discounts—so much so that I’m predicting 20%+ price upside from each of them in 2020.
That’s not all, either.
They also pay far higher dividends—I’m talking an 8% payout, on average. Drop $500K into this 5-fund “mini-portfolio” and you’re looking at a smooth $40,000 in yearly dividends.
How’s that for a retirement-income stream? And on way less than a million bucks, too!
Disclosure: Brett Owens and Michael Foster are contrarian income investors who look for undervalued stocks/funds across the U.S. markets. Click here to learn how to profit from their strategies in the latest report, "7 Great Dividend Growth Stocks for a Secure Retirement."
