
Ball Corporation (NYSE:BLL) reported second-quarter 2019 adjusted earnings of 64 cents per share, missing the Zacks Consensus Estimate of 65 cents by a whisker. The reported figure, however, improved 10.3% on a year-over-year basis on strong demand trends in both metal beverage packaging and aerospace businesses.
On a reported basis, the company posted earnings of 58 cents per share compared with 34 cents per share recorded in the prior-year quarter.
Total revenues declined to $3,017 million in the reported quarter from $3,101 million in the year-ago quarter. The top line also missed the Zacks Consensus Estimate of $3,028 million. Global beverage can volumes were up 5% in the quarter, driven by a 13% increase in global specialty can volumes.
Operational Update
Cost of sales went down 2.2% year over year to $2,428 million. Gross profit slipped to $589 million from the year-ago quarter’s $617 million. Gross margin came in at 19.5% during the second quarter compared with the prior-year quarter’s 19.9%.
Selling, general and administrative expenses dipped 12.6% year over year to $111 million. Adjusted operating income was down 1.4% to $347 million from the year-ago quarter’s reported figure of $352 million. The company reported operating margin of 11.5% compared with the prior-year’s 11.3%.
Ball Corporation Price, Consensus and EPS Surprise
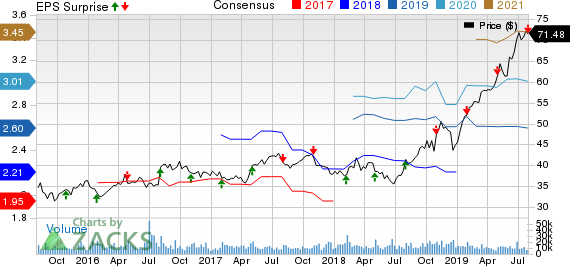
Ball Corporation price-consensus-eps-surprise-chart | Ball Corporation Quote
Segment Performance
The Beverage packaging’s North and Central America segment revenues were up 3.6% year over year to $1,286 million in the April-June quarter. Operating earnings of $141 million decreased 10.2% year over year.
Sales in the Beverage packaging, Europe segment came in at $715 million in the reported quarter, improving 1.7% year over year. Operating earnings climbed 16% year over year to $87 million.
The Beverage packaging South America segment’s revenues edged down to $377 million during the June-end quarter from $379 million in the comparable period last year. Operating earnings moved down to $65 million from $66 million recorded in the year-earlier quarter. Industry beverage can demand in Brazil remains solid.
In the Aerospace and Technologies segment, sales jumped 30.6% year over year to $379 million. Operating earnings surged 58.3% year over year to $38 million. As of the second quarter-end, the segment’s contracted backlog exceeded $2 billion. Since then, the company has won contracts worth $4.8 billion, which have not yet been included in the backlog.
Financial Condition
Ball Corporation reported cash and cash equivalents of $764 million at the end of the second quarter, up from $549 million held at the end of the year-earlier quarter. Cash flow from operating activities were $253 million during the six-month period ended Jun 30, 2019 compared with $434 million recorded in the prior-year comparable period. The company’s long-term debt decreased to $6,916 million as of Jun 30, 2019, from $7,171 million as of Jun 30, 2018.
Outlook
Ball Corporation forecasts higher-than-anticipated growth in global beverage container businesses in the upcoming period. The company aims to accelerate growth investments. In 2019, the company expects to surpass its long-term target of 10-15% earnings per share growth goal.
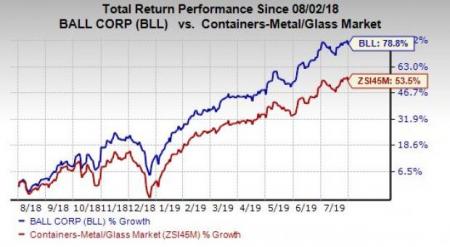
Share Price Performance
Ball Corporation’s shares have appreciated around 78.8% over the past year, outperforming the industry’s growth of 53.5%.
Zacks Rank & Stocks to Consider
Ball Corporation currently carries a Zacks Rank #3 (Hold).
Some better-ranked stocks in the Industrial Products sector are John Bean Technologies Corp. (NYSE:JBT) , CECO Environmental Corp. (NASDAQ:CECE) and Roper Technologies, Inc. (NYSE:ROP) . While John Bean Technologies and CECO Environmental sport a Zacks Rank #1 (Strong Buy), Roper Technologies carries a Zacks Rank #2 (Buy), at present. You can see the complete list of today’s Zacks #1 Rank stocks here
John Bean Technologies has an expected earnings growth rate of 5.9% for the current year. The stock has appreciated 10.8% in a year’s time.
CECO Environmental has an impressive projected earnings growth rate of 84.8% for the ongoing year. The company’s shares have rallied 36.3% over the past year.
Roper Technologies has an estimated earnings growth rate of 9.8% for 2019. The company’s shares have gained 23.3% in the past year.
Looking for Stocks with Skyrocketing Upside?
Zacks has just released a Special Report on the booming investment opportunities of legal marijuana.
Ignited by new referendums and legislation, this industry is expected to blast from an already robust $6.7 billion to $20.2 billion in 2021. Early investors stand to make a killing, but you have to be ready to act and know just where to look.
See the pot trades we're targeting>>
Ball Corporation (BLL): Free Stock Analysis Report
Roper Technologies, Inc. (ROP): Free Stock Analysis Report
John Bean Technologies Corporation (JBT): Free Stock Analysis Report
CECO Environmental Corp. (CECE): Free Stock Analysis Report
Original post
Zacks Investment Research