
Avon Products, Inc. (NYSE:AVP) has been losing sheen due to sluggish Active Representatives growth in the last few quarters. This, in turn, is affecting the company’s top-line performance and profitability. Apparently, the company has lagged earnings estimates in eight of the last 11 quarters. Also, sales missed estimates in five of the last seven quarters.
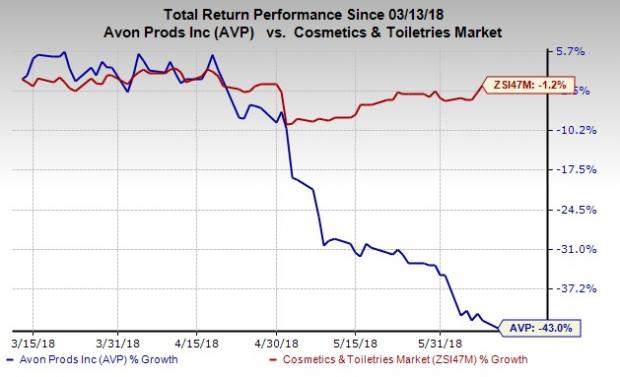
Consequently, this Zacks Rank #4 (Sell) stock has plunged 43% in the past three months, significantly wider than the industry’s decline of mere 1.2%. Also, it has a Momentum Score of D, which indicates feeble chances of recovery.
Let’s Take a Close Look
Avon is witnessing weak Active and Ending Representatives since the last few quarters. In first-quarter 2018, Active Representatives declined 4% year over year due to fall in South Latin America and North Latin America. Further, Ending Representatives dipped 1% on account of softness in South Latin America and North Latin America, offset by growth in Europe, Middle East & Africa. Total units sold also dropped 3% in the quarter.
Further, Active Representatives fell 2%, 3% and 3% in fourth, third and second quarters of 2017. Although Ending Representatives remained flat in the fourth quarter, it declined 2% in both third and fourth quarters of 2017.
Higher supply-chain costs also heavily weighed on adjusted gross margin that contracted 280 basis points (bps) in the first quarter of 2018. Additionally, gross margin included a 310 bps negative impact from the adoption of the new revenue standard.
Moreover, analysts are becoming bearish on the stock as apparent from downward earnings estimates revisions. The Zacks Consensus Estimate of 12 cents for 2018 and 20 cents for 2019 declined a penny for both the years in the past 30 days.
Avon too faces competition from various products and product lines, in both domestic and international markets. As the company operates in a consumer centric market, its ability to garner profits depends largely on how well Avon can predict changes in consumer preferences and spending patterns for beauty products, and respond timely to fulfill the same.
Additionally, material shifts in market demand for a product for any reason may result in increased inventory levels, which may lead to selling goods at lower prices. This, in turn, should ultimately hurt the company’s top and bottom line.
Is There Any Scope for Revival?
Although management remains committed toward boosting Representatives growth by providing deeper insights and analytics into Representative’s behavior and requirements to boost experience, it will take time. Avon also remains encouraged to minimize service disruption along with pilot programs that cover service from end to end. This inspires optimism about the recovery of Avon’s business as Active Representatives, which form a key factor for the success of any direct-selling business operator.
Additionally, Avon remains on track with the Transformation Plan that targets achieving cost savings of $65 million in 2018, of which $15 million was reached in the first quarter. With this, the company intends to reach its three-year cost savings target of $350 million.
Notably, the plan mainly focuses on investing for growth, enhancing cost structure and improving financial flexibility. In this regard, the company has witnessed significant progress compared with its targets of enhancing cost structure and improving financial resilience. Management expects 2018 to be a year of executing significant operational improvements, despite continued competitive pressures.
Though these initiatives look encouraging, we believe that they will surely take time to reflect in the company’s financial performance.
Want Top-Ranked Consumer Staples Stocks? Check These
Inter Parfums, Inc. (NASDAQ:IPAR) pulled off an average positive earnings surprise of 11.8% in the last four quarters. The company sports a Zacks Rank #1 (Strong Buy). You can see the complete list of today’s Zacks #1 Rank stocks here.
Helen of Troy Ltd. (NASDAQ:HELE) delivered an average positive earnings surprise of 17.2% in the last four quarters and carries a Zacks Rank #2 (Buy).
Ollie's Bargain Outlet Holdings, Inc. (NASDAQ:OLLI) , also a Zacks Rank #2 stock, has an impressive long-term earnings growth rate of 23%.
More Stock News: This Is Bigger than the iPhone!
It could become the mother of all technological revolutions. Apple (NASDAQ:AAPL) sold a mere 1 billion iPhones in 10 years but a new breakthrough is expected to generate more than 27 billion devices in just 3 years, creating a $1.7 trillion market.
Zacks has just released a Special Report that spotlights this fast-emerging phenomenon and 6 tickers for taking advantage of it. If you don't buy now, you may kick yourself in 2020.
Click here for the 6 trades >>
Ollie's Bargain Outlet Holdings, Inc. (OLLI): Free Stock Analysis Report
Avon Products, Inc. (AVP): Free Stock Analysis Report
Inter Parfums, Inc. (IPAR): Free Stock Analysis Report
Helen of Troy Limited (HELE): Free Stock Analysis Report
Original post
Zacks Investment Research