Optoelectronics solutions provider Applied Optoelectronics (NASDAQ:AAOI) stock has rebound despite the delays in 5G deployment. The provider of optical fiber laser products to data centers, telcos and internet network infrastructure companies has seen a recovery from the pandemic triggered lows. While data center business remains soft, the Company is seeing a rebound in its telecom business to offset the declines.
China remains a strong end-market as it resumes 5G deployment and U.S. broadband providers continue to bolster networks. This has caused its CATV business to hit three-year record levels. The Company is both a pandemic and post-pandemic reopening benefactor. The need for bandwidth continues to ramp up. While data centers are managing inventory normalization after the pandemic spike, enterprises will offset reversions as works return to offices. Prudent investors seeking exposure in the internet infrastructure growth in both the U.S. and China can monitor shares for opportunistic pullback levels to consider scaling into a position.
Q1 Fiscal 2021 Earnings Release
On May 6, 2021, Applied Optoelectronics reported its fiscal Q1 2021 results for the quarter ending Mar 2021. The Company reported an earnings-per-share (EPS) loss of (-$0.21) versus (-$0.26) consensus analyst estimates, a $0.05 beat. Revenues grew 22.82% year-over-year (YoY) to $49.7 million, beating analyst estimates by $343K. GAAP gross margins rose to 21.6% compared to 15.7% in year-ago same period. Applied Opto CEO, Dr. Thompson Lin stated:
“Market dynamics played out as we expected, and we are pleased to deliver results in line with out expectations. While we continue to see softness in our datacenter business, we are encouraged by the recovery that we saw in the telecom market and by the continued strength in our CATV business. We delivered a record first quarter for our CATV business, and we ended the quarter with a strong backlog of CATV products which we expect to continue to drive growth in this segment going forward.”
Q2 Fiscal 2021 Guidance
Applied Opto provided Q2 fiscal 2021 Non-GAAP EPS range to be a loss of (-$0.14) to (-$0.21). Revenues are expected to come in between $51 million to $56 million.
Conference Call Takeaways
CEO Lin set the tone:
“Total revenue for our CATV products increased to more than four time its prior-year level and was increased 17% sequentially, off a strong fourth quarter, to $18.6 million. This is our highest quarterly revenue for this segment in three years.”
He went on to detail the initial soft 5G deployment with China telecom customers but saw the recovery take shape in Q4 bolstering Q1 telecom revenues by 75% YoY and 28% sequentially to $4.5 million. He stated:
“Looking ahead, we believe China will continue to make investments in both their 5G and fiber-to-the-home infrastructure. And we believe we are well positioned to sell lasers in both of these markets.”
The Company expects to harvest its four client wins from Q4 including three datacenters and one 5G. The datacenter softness is a reversion effect back to inventory normalization after the unprecedented spike during the pandemic from work-at-home demand. Telcos are continuing to ramp up networks in the U.S. helping to pump the CATV segment.

AAOI Opportunistic Pullback Levels
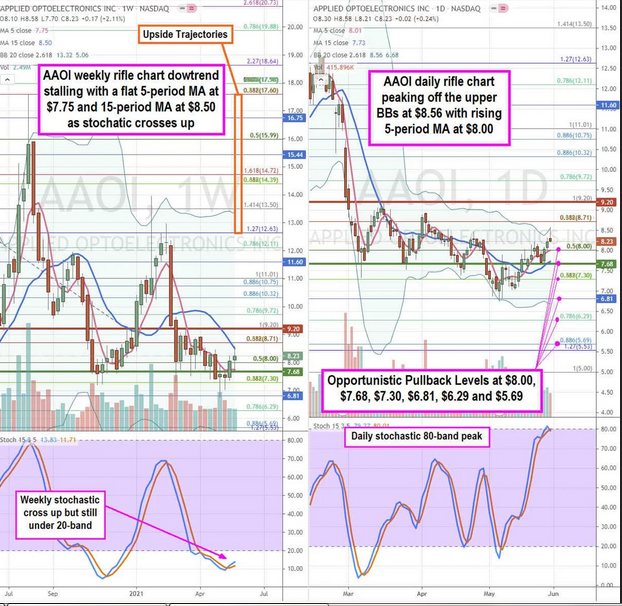
Using the rifle charts on the weekly and daily time frames provides a precision view of the landscape for AAOI stock. The weekly rifle chart downtrend has stalled as the 5-period moving average (MA) went flat at $7.75 as shares tightened to the 15-period MA at $8.50. This caused the weekly stochastic to cross up at the 10-band. The weekly hard formed a market structure high (MSH) sell triggered when shares broke the $9.20 Fibonacci (fib) level. The weekly market structure low (MSL) buy triggered on the breakout above $7.68. The daily rifle chart uptrend peaked off the daily upper Bollinger Bands (BBs) at $8.56 with a rising 5-period MA at the $8.00 fib. The daily stochastic completed a full oscillation from the 20-band up to the 80-band potential peak. Prudent investors can watch the daily stochastic cross down to present opportunistic pullback levels at the $8.00 fib, $7.68 weekly MSL trigger, $7.30 fib, $6.81 fib, $6.29 fib, and the $5.69 fib. Upside trajectories range from the $12.63 fib up to the $17.60 fib level. Keep an eye on peers LITE and IIVI as these photonic stocks also tend to move together.
