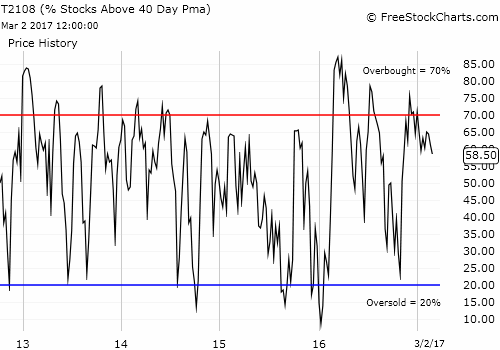
- AT40 = 58.5% of stocks are trading above their respective 40-day moving averages (DMAs)
- AT200 = 68.0% of stocks are trading above their respective 200DMAs
- VIX = 11.8 (volatility index)
- Short-term Trading Call: neutral
Commentary
And this is why I appreciate hedging…and using Caterpillar (NYSE:CAT) as my most common hedge was particularly fortuitous today.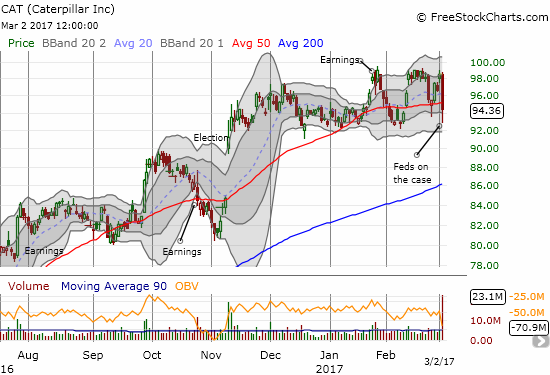
Caterpillar (CAT) sank 4.3% as federal agents executed search warrants at CAT facilities.
On Thursday morning (March 2nd), I dutifully doubled down on my put options on Caterpillar (CAT) based on the hedging I explained on Monday. I felt justified as CAT approached resistance at $99/share. A few hours later, I was alerted that my limit order to sell all my put options triggered. I was so shocked, I thought a market crash was underway. While the S&P 500 (SPY (NYSE:SPY) was indeed struggling, the extra pressure on CAT was strictly company specific. From the company’s press release titled “Caterpillar Continues to Cooperate with Law Enforcement.”:
On March 2, 2017, law enforcement authorities entered three Peoria-area Caterpillar Inc (NYSE:CAT). facilities, including the corporate headquarters, to execute a search and seizure warrant. The warrant is focused on the collection of documents and electronic information. Caterpillar is cooperating with law enforcement.
While the warrant is broadly drafted, we believe the execution of this search warrant is regarding, among other things, export filings that relate to the CSARL matter first disclosed in Caterpillar’s Form 10-K filed on February 17, 2015, and updated in Caterpillar’s most recent Form 10-K filed with the SEC on February 15, 2017.
Given prior disclosures, I am guessing that the selling was overdone. However, this is the kind of sharp and violent reaction that can happen when notably negative news disturbs the general complacency in a stock or index. This complacency comes in the form of ignoring or downplaying downside risks. This dynamic makes hedging against complacency particularly potent. In this case, it turned a good amount of red into a very profitable day.
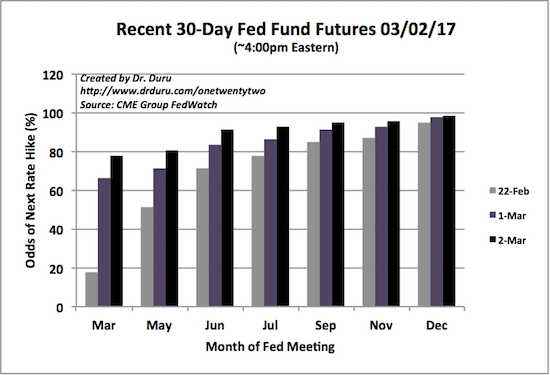
Seeing the poor performance of several other trades on a day when the S&P 500 “only” dropped 0.6% woke me to the fact that my neutral trading call did not prevent me from getting bloated with long positions. I hope to make the proper adjustments in the days and week to come. This adjustment is important because, as I noted in the last, “Above 40,” the sharp rise in rate hike expectations is forcing some quick market adjustments. The U.S. dollar should rise at least into the March Fed meeting. I imagine there are many market participants that are making similar adjustments. I am not surprised that part of the adjustment included profit-taking as the odds of a March rate hike surged even higher from 66.4% to 77.5%.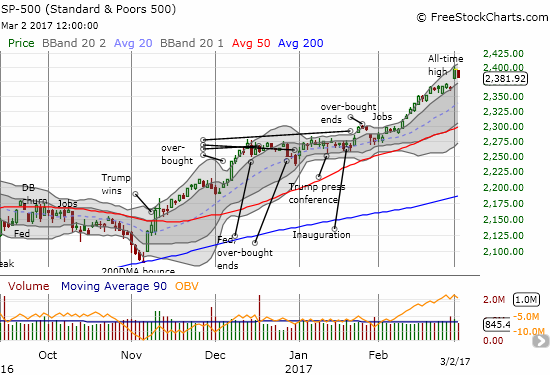
The S&P 500 (NYSE:SPY) lost all its incremental gains from the previous day’s bullish breakout.
The market’s implied odds for the timing of the next rate hike jumped popped higher again. The 77.5% chance is close enough to certain with 2 weeks to go until meeting time.
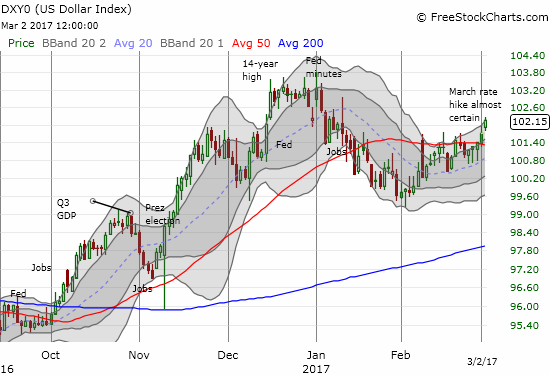
The U.S. dollar index confirmed its 50DMA breakout with convincingly follow-through.
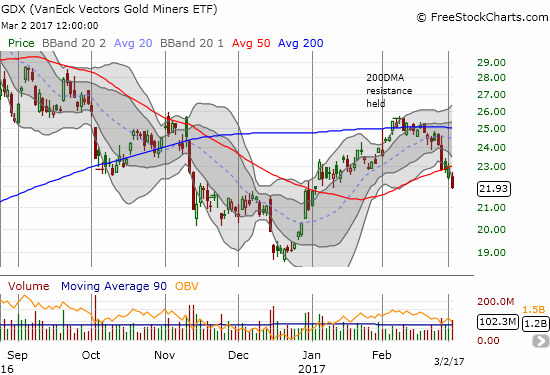
The resurgent dollar and rate hike odds took their toll on precious metal plays. In particular, silver (NYSE:SLV) and gold miners (NYSE:GDX) plunged 3.7% and 4.6% respectively. These drops are each bearish. SLV closed below its 200DMA and reversed three weeks of gains in 1 day. That moved announced the end of the upward momentum with an exclamation point. GDX broke down below its 50DMA and confirmed 200DMA resistance. The December lows are now in play.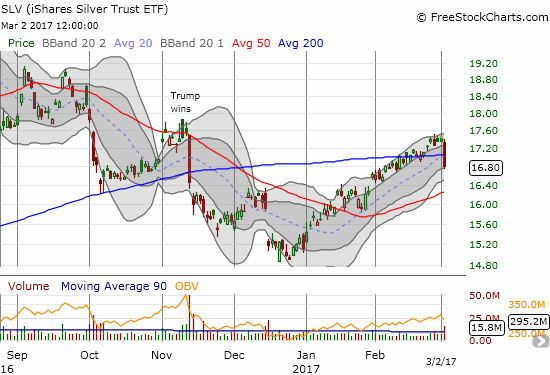
The iShares Silver Trust ended its upward momentum from the December lows.
The VanEck Vectors Gold Miners ETF (NYSE:GDX) broke down below 50DMA support and returned to bearish territory.
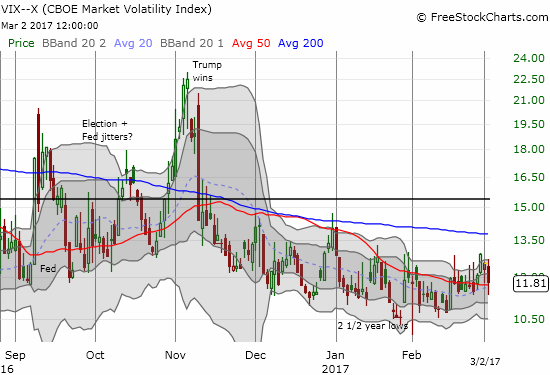
While the S&P 500 and precious metals adjusted downward, the volatility index did so as well…much to my bewilderment. I was even more surprised to see the volatility-based products move inversely to their typical volatility reaction. I took advantage of the decline in ProShares Short VIX Short-Term Futures (NYSE:SVXY) to buy back into a call option even as I lamented the lack of reaction in my put options on ProShares Ultra VIX Short-Term Futures (NYSE:UVXY). Going forward, I will likely switch my bias to hedging going long UVXY before reversing course just ahead of the March 15th announcement on monetary policy from the U.S. Federal Reserve.
Somehow, the day’s decline in the stock market did not motivate a rush into VIX products!
AT40 (T2108), the percentage of stocks trading above their 40-day moving averages (DMAs), fell back to 58.5%. My favorite technical indicator did not break below the low from Tuesday which is a slightly positive sign. Still, AT40 has yet to confirm the latest bullish breakout of the S&P 500.
While stocks were selling off, especially in dollar and rate sensitive names, Tesla (NASDAQ:TSLA) continued its bid to heal from a Goldman Sachs (NYSE:GS) downgrade. Yesterday the stock ALMOST confirmed a successful test of 50DMA support but faded into the close and between the lower-Bollinger® Bands.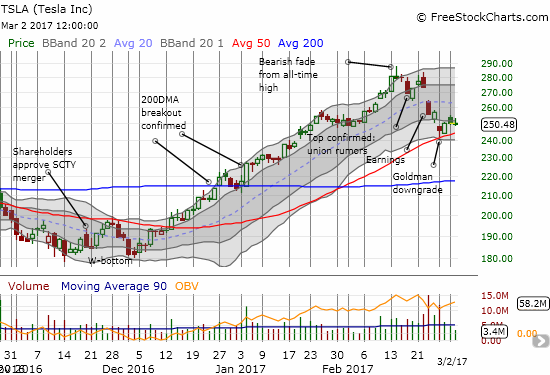
Tesla (TSLA) is healing. Perhaps another bounce off 50DMA support will give buyers more confidence. Watch out if the 50DMA gives way…
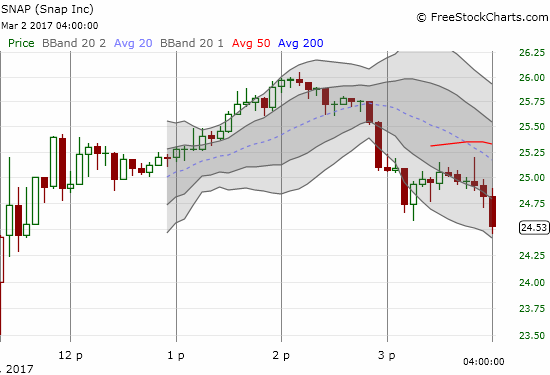
The biggest trading news of the day was of course Snap Inc. (NYSE:SNAP). This IPO came to market with big fanfare and a sky high valuation. The stock has been on the top of my wish list for shorting. I set a limit order for $26 and gulped hard. With 200M shares flooding the market, there was clearly enough inventory for short-sellers.
A lunchtime consolidation led to a sustained intraday breakout. The sellers rushed in after 2pm to lock in their profits.
The 5-minute chart is fascinating. There are four distinct phases of trading: 1) the initial pop as traders and investors scrambled with the stock opening $7 above its $17 IPO price, 2) consolidation, 3) breakout and renewed confidence in the IPO, and 4) rushed profit-taking. Phase 4 will likely stick in the minds of traders going into Friday. Jim Cramer probably did not help the speculators by telling folks who were lucky enough to get IPO shares at $17 to sell; he also called the stock far too expensive for his tastes. SNAP lost $514.6M in 2016, 38% worse than the previous year although revenue grew 700% to $404.5M. SNAP now sports a market cap of over $28B, greater than the valuations awarded to the Google (NASDAQ:GOOGL) IPO in 2004 ($23B) and Twitter (NYSE:TWTR) in 2013 ($24B). The IPO shares were sold without voting rights.
I was (pleasantly) surprised to see several analyst shops rush out lukewarm to outright bearish notes on SNAP (from CNBC):
Research firm Pivotal Research Group, the first firm to issue a rating on Snap, declared it a Sell shortly after it started trading, with a price target of $10 per share…
Instinet also issued a negative rating, saying investors will likely be disappointed by the company’s financial results…
Aegis Capital’s Victor Anthony said in a note to investors that the research company ‘conducted extensive checks within the ad industry and find that marketers are enthusiastic about the prospects of creating ads to get in front of Snap’s coveted demographic. As such, we see Snap as a sustained ad share gainer over the next two years. That alone should be enough to lead to upside to the offering price range this year’… Still, the company has a Hold rating on the stock and a $22 price target.
Above the 40 uses the percentage of stocks trading above their respective 40-day moving averages (DMAs) to assess the technical health of the stock market and to identify extremes in market sentiment that are likely to reverse. Abbreviated as AT40, Above the 40 is an alternative label for “T2108”, which was created by Worden. Learn more about T2108 on my T2108 Resource Page. AT200, or T2107, measures the percentage of stocks trading above their respective 200DMAs.
Active AT40 (T2108) periods: Day #259 over 20%, Day #79 over 30%, Day #78 over 40%, Day #76 over 50%, Day #1 over 60% (overperiod), Day #25 under 70% (underperiod)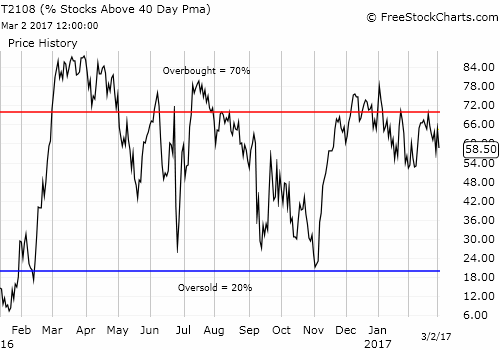
Black line: AT40 (T2108) (% measured on the right)
Red line: Overbought threshold (70%); Blue line: Oversold threshold (20%)
Be careful out there!
Full disclosure: long UVXY put and call options, long and short various positions on the U.S. dollar, short SNAP, long TWTR and short a TWTR put option, long SVXY call option.

