
Amphenol (NYSE:APH) reported second-quarter 2019 adjusted earnings of 92 cents per share that missed the Zacks Consensus Estimate by a penny but increased 2.2% from the year-ago quarter’s figure.
Net sales increased 1.7% year over year to $2.02 billion, which was slightly better than the consensus mark of $2.01 billion. Unfavorable foreign exchange negatively impacted sales by $42 million.
Amphenol slashed guidance for 2019. The company expects demand for its solutions to moderate in some of the end markets, particularly communications equipment.
The company stated that restrictions imposed by the U.S. government on sales to certain Chinese entities are negatively impacting demand. Moreover, increased level of uncertainty in the global economy is a major concern.
Amphenol Corporation Price, Consensus and EPS Surprise
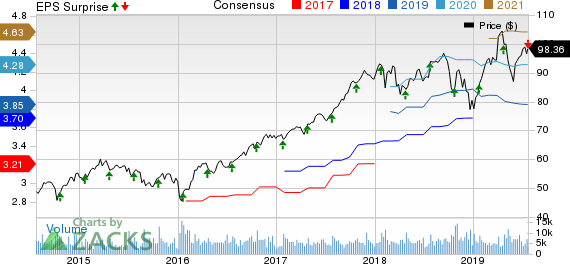
Amphenol Corporation price-consensus-eps-surprise-chart | Amphenol Corporation Quote
Quarter Details
The year-over-year increase in revenues was driven by strong growth across the company’s end markets, including military, commercial air, mobile networks and mobile devices. Acquisitions also helped in driving the top line.
Interconnect Products and Assemblies (95.5% of net sales) sales increased 3% from the year-ago quarter to $1.93 billion. However, Cable Products and Solutions sales were $89.7 million, down 19.3% year over year.
Gross margin contracted almost 40 basis points (bps) on a year-over-year basis to 32.1%.
Selling, general and administrative expenses (SG&A) as percentage of revenues declined 10 bps to 11.9%.
Consolidated operating margin contracted 30 bps on a year-over-year basis to 20.3%, driven by improved operational efficiency.
Segment wise, Interconnect Products and Assemblies operating margin declined 20 bps to 22.2%, while Cable Products and Solutions operating margin contracted 350 bps to 9.7%.
Acquisitions
In June, Amphenol acquired CONEC Elektronische Bauelemente GmbH and Kopek Industries.
Based in Germany, CONEC designs and manufactures a wide array of connectors primarily for customers in the industrial market. Kopek, which is based in China, primarily supplies RF passive interconnect components for the broadband market to Amphenol.
In July, the company purchased Bernd Richter GmbH and the GJM Group.
Based in Germany, Bernd Richter designs and manufactures high-technology cable assemblies primarily for medical equipment customers. Spain-based GJM is a provider of interconnect assemblies for automotive applications.
These four acquisitions collectively generate annual sales of approximately $150 million.
Balance Sheet and Cash Flow
As of Jun 30, 2019, Amphenol had cash and cash equivalents worth $997 million, lower than $1.29 billion as of Mar 31, 2019.
Cash flow from operations was $322 million compared with $344 million in the previous quarter.
During the quarter, the company repurchased 2.6 million shares for $249 million.
On Jul 23, 2019, Amphenol’s board of directors approved a 9% dividend hike, taking the value to 25 cents from 23 cents per share.
Guidance
For the third quarter of 2019, Amphenol projects sales between $1.960 billion and $2 billion.
Adjusted earnings are expected between 86 cents and 88 cents per share.
For 2019, Amphenol expects sales between $7.920 billion and $8 billion, down from the previous guidance of $8.130-$8.250 billion. The latest guidance range indicates sales to decline 2-3% year over year.
Moreover, the company now expects adjusted earnings of $3.56-$3.60 per share, down from the previous guidance of $3.80-$3.86. The latest guidance indicates a decrease of 5-6% year over year.
Zacks Rank & Stocks to Consider
Currently, Amphenol has a Zacks Rank #3 (Hold).
Lattice Semiconductor (NASDAQ:LSCC) , Alteryx (NYSE:AYX) and Rosetta Stone (NYSE:RST) are some better-ranked stocks in the broader computer and technology sector. All three stocks sport a Zacks Rank #1 (Strong Buy). You can see the complete list of today’s Zacks #1 Rank stocks here.
While Lattice Semiconductor and Alteryx are set to report quarterly results on Jul 30 and 31, respectively, Rosetta Stone is scheduled to report on Aug 6.
The Hottest Tech Mega-Trend of All
Last year, it generated $8 billion in global revenues. By 2020, it's predicted to blast through the roof to $47 billion. Famed investor Mark Cuban says it will produce "the world's first trillionaires," but that should still leave plenty of money for regular investors who make the right trades early.
See Zacks' 3 Best Stocks to Play This Trend >>
Rosetta Stone (RST): Free Stock Analysis Report
Lattice Semiconductor Corporation (LSCC): Free Stock Analysis Report
Amphenol Corporation (APH): Free Stock Analysis Report
Alteryx, Inc. (AYX): Free Stock Analysis Report
Original post
Zacks Investment Research