
American Tower Corporation (NYSE:AMT) reported third-quarter 2019 consolidated adjusted funds from operations (AFFO) per share of $2, beating the Zacks Consensus Estimate of $1.96. Further, the reported figure improves 8.1%, year over year.
Results indicate growth in revenues from property segment as well improvement in adjusted EBITDA. Further, cash from operations for the September-end quarter improved on a year-over-year basis.
The company generated total revenues of $1.95 billion, beating the Zacks Consensus Estimate of $1.86 billion. The figure climbed 9.4% year over year.
Operating Metrics
Adjusted EBITDA in the reported quarter was $1,229 million, up 12.2% from the prior-year quarter.
Adjusted EBITDA margin was 62.9% in the third quarter. Selling, general, administrative and development expenses totaled $187.9 million compared with the $177.9 million incurred in the year-earlier quarter. Operating income was $728.3 million compared with the $567.2 million reported in the year-ago quarter.
Cash Flow and Liquidity
In the third quarter of 2019, American Tower generated $937 million of cash from operating activities, up 24.4% year over year. Free cash flow in the quarter was $660 million, up 17.6% year over year.
At the end of the reported quarter, the company had around $1.4 billion in cash and cash equivalents compared with the $1.2 billion posted at the end of December 2018. Further, it had around $3.8 billion under its revolving credit facilities (net of any outstanding letters of credit).
Property Segment
Quarterly revenues grossed $1,922 million, up 9.7% year over year. Operating profit was $1,253 million and operating profit margin was 65% during third-quarter 2019.
Within the Property segment, revenues from the United States totaled $1,096 million, up 14.4% year over year. Total international revenues amounted to $826 million, up 4% year over year. Within this, revenues from Asia totaled $313 million, declining 3.3% year over year. EMEA revenues grossed $182 million, up 8.9% year over year. Latin America revenues totaled $332 million, improving 9% year over year.
Services Segment
Quarterly revenues totaled $32 million, down 5.6% year over year. Operating profit was $17 million and operating profit margin was 53% in the July-September quarter.
Outlook for 2019
For 2019, American Tower has revised its guidance and anticipates property revenues of $7,420-$7,480 million, reflecting an improvement of 1.8% at the mid-point. Adjusted EBITDA is projected at $4,690-$4,730 million, indicating a mid-point increase of 0.9%. Consolidated AFFO is estimated in the $3,480-$3,520 million band, reflecting a mid-point contraction of 1.1%.
Conclusion
Amid increasing U.S. consumer demand for mobile data, American Tower witnessed 7.1% U.S. organic tenant billings growth during the July-September quarter. Additionally, growth in property revenues boosted the top line. Moreover, accretive investments in communication sites is a positive.
Currently, American Tower carries a Zacks Rank #3 (Hold). You can see the complete list of today’s Zacks #1 Rank (Strong Buy) stocks here.
American Tower Corporation (REIT) Price, Consensus and EPS Surprise
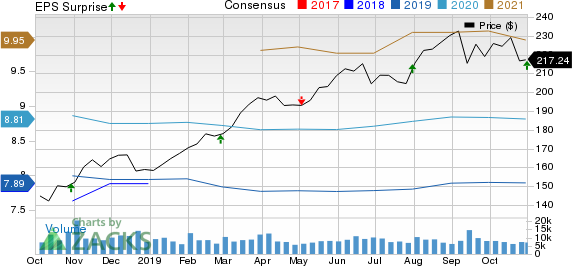
American Tower Corporation (REIT) price-consensus-eps-surprise-chart | American Tower Corporation (REIT) Quote
Performance of Other REITs
Highwoods Properties Inc.’s (NYSE:HIW) third-quarter FFO per share of 88 cents surpassed the Zacks Consensus Estimate of 85 cents. The reported tally excluded the net impact of 5 cents relating to the company’s market rotation plan. The figure also improved 2.3% year over year.
Boston Properties Inc.’s (NYSE:BXP) third-quarter 2019 FFO per share of $1.64 surpassed the Zacks Consensus Estimate of $1.62. Nonetheless, the reported figure remained flat year over year.
Ventas, Inc. (NYSE:VTR) delivered third-quarter normalized FFO per share of 96 cents, beating the Zacks Consensus Estimate of 94 cents. However, the figure came in lower than the year-ago tally of 99 cents.
Note: Anything related to earnings presented in this write-up represent funds from operations (FFO) — a widely used metric to gauge the performance of REITs.
Free: Zacks’ Single Best Stock Set to Double
Today you are invited to download our just-released Special Report that reveals 5 stocks with the most potential to gain +100% or more in 2020. From those 5, Zacks Director of Research, Sheraz Mian hand-picks one to have the most explosive upside of all.
This pioneering tech ticker had soared to all-time highs and then subsided to a price that is irresistible. Now a pending acquisition could super-charge the company’s drive past competitors in the development of true Artificial Intelligence. The earlier you get in to this stock, the greater your potential gain.
Download Free Report Now >>
American Tower Corporation (REIT) (AMT): Free Stock Analysis Report
Boston Properties, Inc. (BXP): Free Stock Analysis Report
Ventas, Inc. (VTR): Free Stock Analysis Report
Highwoods Properties, Inc. (HIW): Free Stock Analysis Report
Original post