
Allscripts Healthcare Solutions, Inc. (NASDAQ:MDRX) reported fourth-quarter 2018 adjusted earnings per share (EPS) of 20 cents, which missed the Zacks Consensus Estimate by a penny. However, the bottom line improved 11.1% on a year-over-year basis.
On a non-GAAP basis, revenues totaled $538.4 million, which fell short of the Zacks Consensus Estimate by 4.5%. The top line also inched down 1.5% year over year. On a reported basis, revenues amounted to $442.3 million in the quarter, reflecting a 1.4% increase year over year.
Bookings came in at $531 million, significantly up by 69.1% from the prior-year quarter’s tally.
The stock carries a Zacks Rank #3 (Hold).
2018 at a Glance
Full-year revenues, on a non-GAAP basis, grossed $2.13 billion, up 15.6% from 2017. The figure, however, lagged the Zacks Consensus Estimate of $2.15 billion. On a reported basis, revenues came in at $1.75 billion, up 16.8% from 2017.
Adjusted EPS for 2018 was 72 cents, which increased 16.1% from 2017’s figure but missed the Zacks Consensus Estimate by a penny.
Notably, Allscripts reports through two segments — Software delivery, Support and Maintenance, and Client Services.
On a reported basis, 2018 Software delivery, Support and Maintenance revenues summed $1.13 billion (64.5% of net revenues). Meanwhile, Client services revenues were $621.7 million (35.5%).
Allscripts Healthcare Solutions, Inc. Price, Consensus and EPS Surprise
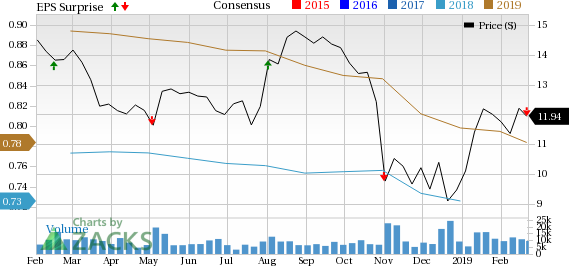
Allscripts Healthcare Solutions, Inc. Price, Consensus and EPS Surprise | Allscripts Healthcare Solutions, Inc. Quote
Segment Details
Software delivery, Support and Maintenance
In the quarter under review, revenues at the segment grossed $289.1 million on a reported basis, up 5.3% from the year-ago quarter's tally.
Client Services
At this segment, revenues totaled $153.2 million, down 5.4% from the year-ago quarter's figure.
Margins
Gross profit in the fourth quarter was $188.1 million, up 6.8% from the year-ago quarter's level. As a percentage of revenues, gross margin was 42.5%, up 210 basis points (bps) from the year-ago figure.
Adjusted gross profit amounted to $253.5 million, down 2.9% year over year. Adjusted gross margin was 47.1%, down 70 bps from the prior-year quarter.
Adjusted operating income in the quarter was $68.1 million, down 10% year over year. Adjusted operating margin was 12.6%, as a percentage of revenues.
Guidance
For 2019, adjusted EPS are expected at the lower end of 65-70 cents. The Zacks Consensus Estimate is pegged at 78 cents, much above the projected range.
For the first quarter of 2019, adjusted revenues are expected between $430 million and $440 million. The Zacks Consensus Estimate is pinned at $560.2 million, well above the guided range.
Full-year bookings are expected between $900 million and $1 billion.
Summing Up
Allscripts ended the fourth quarter on a tepid note. The company continues to gain from the core Software, Delivery, Support and Maintenance units, which delivered solid growth in the quarter. Significant growth in fourth-quarter bookings also buoys optimism. The company’s growth in revenue cycle services along with the recently-closed acquisition of HealthGrid is likely to boost its FollowMyHealth patient engagement platform. These apart, management is optimistic about the collaboration with Microsoft (NASDAQ:MSFT), earlier this year.
On the flip side, the core Client Services unit witnessed a soft fourth quarter. The company also saw a significant contraction in margins in the quarter. Moreover, Allscripts is exposed to integration risks. Intense competition in the niche space is an added concern.
Earnings of MedTech Majors at a Glance
Some better-ranked MedTech stocks that delivered solid quarterly results are Varian Medical Systems (NYSE:VAR) , AngioDynamics (NASDAQ:ANGO) and CONMED Corporation (NASDAQ:CNMD) .
Varian reported fiscal first-quarter adjusted EPS of $1.06, in line with the Zacks Consensus Estimate. Revenues of $741 million outpaced the consensus mark of $717.9 million. The stock has a Zacks Rank #2 (Buy).
AngioDynamics’ fiscal second-quarter adjusted EPS of 22 cents exceeded the Zacks Consensus Estimate by a penny. Revenues totaled $91.5 million, which surpassed the consensus estimate by 2.9%. The stock sports a Zacks Rank #1 (Strong Buy). You can see the complete list of today’s Zacks #1 Rank stocks here.
CONMED delivered fourth-quarter adjusted EPS of 73 cents, in line with the Zacks Consensus Estimate. Revenues of $242.4 million exceeded the Zacks Consensus Estimate of $229.2 million. The stock carries a Zacks Rank of 2.
Wall Street’s Next Amazon (NASDAQ:AMZN)
Zacks EVP Kevin Matras believes this familiar stock has only just begun its climb to become one of the greatest investments of all time. It’s a once-in-a-generation opportunity to invest in pure genius.
Allscripts Healthcare Solutions, Inc. (MDRX): Free Stock Analysis Report
AngioDynamics, Inc. (ANGO): Free Stock Analysis Report
Varian Medical Systems, Inc. (VAR): Free Stock Analysis Report
CONMED Corporation (CNMD): Free Stock Analysis Report
Original post
Zacks Investment Research