
Adtalem Global Education Inc. (NYSE:ATGE) posted mixed first-quarter fiscal 2019 results, wherein earnings surpassed analysts’ expectation while revenues lagged the same. While adjusted earnings (excluding special items) of 45 cents beat the consensus mark of 41 cents by 9.8%, revenues of $284.2 million missed the same by 4%.
Adjusted earnings increased 9.8% on a year-over-year basis.
However, total revenues decreased 3.1% from the year-ago figure, due to segmental decline in Professional Education, and Technology and Business segments.
Adtalem Global Education Inc. Price, Consensus and EPS Surprise
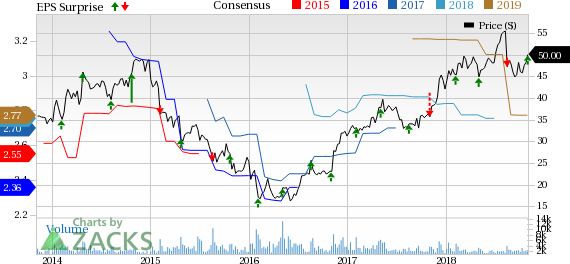
Adtalem Global Education Inc. Price, Consensus and EPS Surprise | Adtalem Global Education Inc. Quote
Operating Highlights
Adtalem’s total operating costs and expenses grew 8.9% year over year to $286.7 million in the quarter. Adjusted operating income was $37 million, reflecting an increase of 19.4% from the prior-year quarter.
Segment Details
Medical and Healthcare: In the fiscal first quarter, segmental revenues of $202.1 million rose 5.7% from the year-ago level, led by growth at Chamberlain University, along with Medical and Veterinary schools.
Revenues from the Chamberlain University were flat from the year-ago quarter at $113.7 million, driven by higher new as well as total student enrollment. New student enrollment increased 9.5% and total student count grew 4.1% in the September 2018 session.
Revenues from Medical and Veterinary schools jumped 14.3% year over year. New and total student enrollment increased 9.5% and 2.5%, respectively, in the September 2018 semester.
Adjusted operating income of the segment was $40.7 million, up 54.4% from the prior-year quarter.
Professional Education: The segment’s revenues of $35.6 million were down 11% year over year, primarily due to a planned shift to hold the Association of Certified Anti-Money Laundering Specialists (“ACAMS”) North American annual conference in the second quarter of fiscal 2019 instead of the first quarter of fiscal 2018.
Technology and Business: The segment recorded revenues of $47.3 million, down 24.3% year over year. The top line declined 4.2% on a constant-currency basis, primarily due to increased competition and reduced government funding. New and total student enrollment increased 23.8% and 3.5%, respectively, on a year-over-year basis.
The company recorded adjusted operating loss of $2.7 million during fiscal first quarter against income of $1.9 million reported in the prior-year period.
Notably, under the Home Office and Other, adjusted operating loss was $5.7 million in the fiscal first quarter.
Liquidity & Cash Flow
As of Sep 30, 2018, Adtalem’s cash and equivalents were $408.8 million, down from $430.7 million on Jun 30, 2018. Cash flow provided by operating activities totaled $78 million at the end of fiscal first quarter, down from $90.3 million in the year-ago period.
Fiscal Second-Quarter Guidance
Revenues are expected to grow approximately 3-4% year over year. Adjusted operating costs are expected in the range of 5-6%.
Fiscal 2019 Guidance
Total revenues are now anticipated to grow at approximately 4% for the year. Adjusted earnings are anticipated to grow 2-3%. Capital spending is expected in the range of $70-$75 million. The effective income tax rate for the fiscal year is likely to be around 17-18%.
Zacks Rank & Stocks to Consider
Currently, Adtalem carries a Zacks Rank #3 (Hold). Some better-ranked stocks in the industry are K12 Inc. (NYSE:LRN) , RYB Education, Inc. (NYSE:RYB) and Bridgepoint Education, Inc. (NYSE:BPI) . While K12 and RYB sport a Zacks Rank #1 (Strong Buy), Bridgepoint carries a Zacks Rank #2 (Buy). You can see the complete list of today’s Zacks #1 Rank stocks here.
K12’s earnings per share are expected to increase 11.8% in 2018.
RYB is expected to record an EPS growth rate of 195.5% next year.
Bridgepoint has an expected earnings growth rate of 8.5% for the current year.
Today's Stocks from Zacks' Hottest Strategies
It's hard to believe, even for us at Zacks. But while the market gained +21.9% in 2017, our top stock-picking screens have returned +115.0%, +109.3%, +104.9%, +98.6%, and +67.1%.
And this outperformance has not just been a recent phenomenon. Over the years it has been remarkably consistent. From 2000 - 2017, the composite yearly average gain for these strategies has beaten the market more than 19X over. Maybe even more remarkable is the fact that we're willing to share their latest stocks with you without cost or obligation.
See Them Free>>
Bridgepoint Education, Inc. (BPI): Free Stock Analysis Report
K12 Inc (LRN): Free Stock Analysis Report
Adtalem Global Education Inc. (ATGE): Free Stock Analysis Report
RYB Education, Inc. Sponsored ADR (RYB): Free Stock Analysis Report
Original post
Zacks Investment Research