The companies on our list have the highest dividend yields of the Canadian publicly-traded REITs
In the current volatile marketplace, stocks or REITs that can provide consistent returns look especially attractive to investors. The REITs on our list today have historically provided solid returns to their investors, with an average 9.3% 5-year dividend yield. Their attractive present valuations mean these companies could be a strong addition to your portfolio.

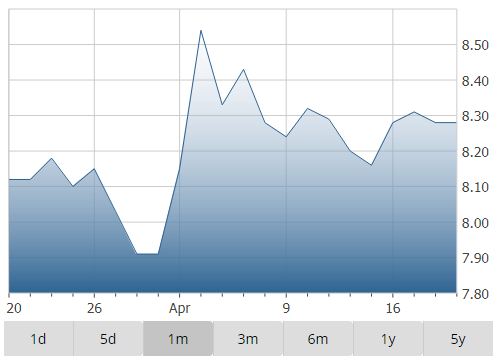
American Hotel Income Properties LP (TO:HOT_u) – $8.28
Specialized REITs
American Hotel Income Properties REIT (AHIP) is a Canada-based trust that focuses on hotel assets, primarily across the United States. AHIP’s portfolio comprises a total of 11,570 hotel rooms across 113 properties, including 41 restaurants.
- Market Cap: $646.2 Million
- YTD Total Return: -9.2%
- Dividend Yield: 9.9%
- Dividend Payout Ratio: 14.5%
- Price / Funds From Operations Per Share: 7.6x


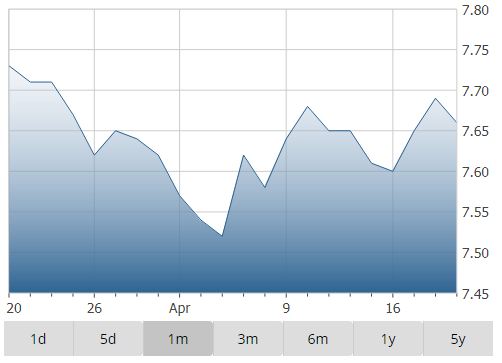
Slate Office REIT (TO:SOT_u) – $7.60
Commercial REITs
Slate Office Real Estate Investment Trust has assets across Canada. Currently, the Trust owns 38 office properties that comprise approximately 6.1 million square feet. Approximately half of its real estate assets are located in Ontario.
- Market Cap: $529.7 Million
- YTD Total Return: -4.4%
- Dividend Yield: 9.9%
- Dividend Payout Ratio: 24.7%
- Price / Funds From Operations Per Share: 8.4x


PRO Real Estate Investment Trust (V:PRV_u) – $2.24
Commercial REITs
Established in 2013, PRO Real Estate Investment Trust focuses on markets in Quebec, Atlantic Canada and Ontario. The Company’s portfolio comprises 43 properties covering ~2.3 million square feet, rented for commercial operations.
- Market Cap: $149.3 Million
- YTD Total Return: -0.3%
- Dividend Yield: 9.4%
- Dividend Payout Ratio: 31.2%
- Price / Funds From Operations Per Share: 10.4x


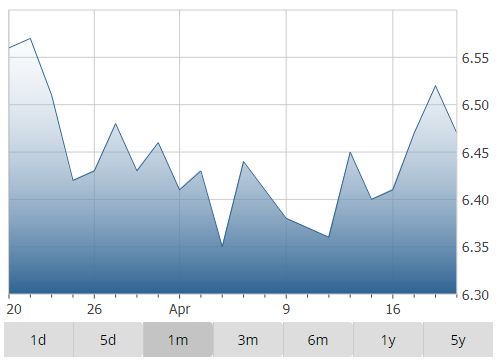
True North Commercial REIT (TO:TNT_u) – $6.41
Commercial REITs
Founded in 2012, True North Commercial REIT owns over 32 properties comprising approximately 2.16 million square feet. Most of the Trust’s assets are situated in Ontario and New Brunswick.
- Market Cap: $305.7 Million
- YTD Total Return: -2.3%
- Dividend Yield: 9.3%
- Dividend Payout Ratio: 30.6%
- Price / Funds From Operations Per Share: 10.2x


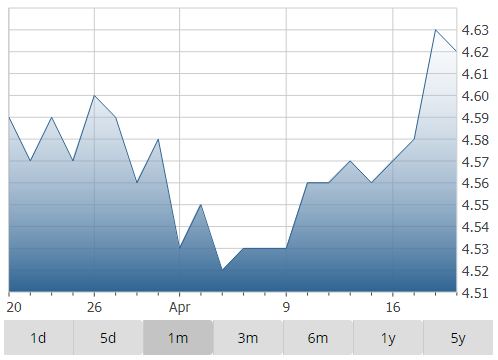
BTB Real Estate Investment Trust (TO:BTB_u) – $4.57
Commercial REITs
BTB Real Estate Investment Trust focuses on acquiring and renting out commercial, office and industrial properties across eastern Canada. The majority of the REITs’ assets are situated in Ontario and Quebec. BTB owns a total of 70 properties that cover more than 5.2 million square feet.
- Market Cap: $222.2 Million
- YTD Total Return: 1.9%
- Dividend Yield: 9.2%
- Dividend Payout Ratio: 21.9%
- Price / Funds From Operations Per Share: 9.6x

Disclosure: Neither the author nor his family own shares in any of the companies mentioned above.
