
In the current environment, with more downside likely to come, one of the best things you and I can do is nothing.
…or at least, next to nothing.
I recently wrote about the virtues of a “no beta” portfolio—basically holding on to cash until it’s time to “back up the truck” at a major market bottom.
But I left the door open—”if you must buy, please promise me you’ll keep it low beta. It’s the next best option to low-beta cash”—and for good reason.
The Case For Low Beta
“Anyone who studies finance learns early on that risk and reward go hand in hand and that with higher expected returns come higher risks. Therefore, low-volatility portfolios, which are by definition less risky than the market average, should underperform.”
That’s a quick recap of the conventional wisdom from S&P Dow Jones Indices Directors, Fei Mei Chan and Craig Lazarra, reporting on a study of low-volatility stocks from the end of 1991 through the end of 2018.
Thing is, the conventional wisdom looks kind of foolish in reality.
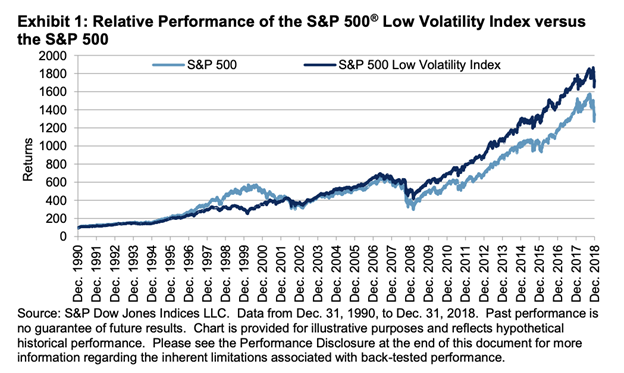
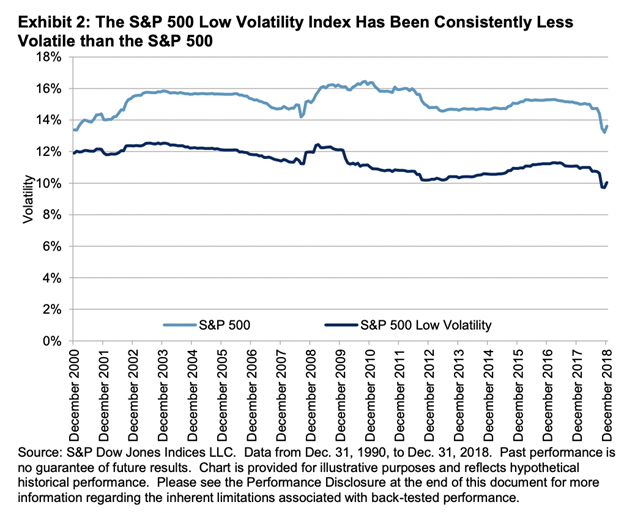
“In the U.S., the S&P 500 Low Volatility Index was the first index vehicle to exploit this phenomenon systematically. … Over the 28-year period, the S&P 500 Low Volatility Index gained 10.7% compared to the S&P 500’s 9.8%, with a 23% lower standard deviation.”
Source: S&P Dow Jones Indices
Put more succinctly, the index has outperformed the S&P 500, and done so at a substantially lower level of volatility.
Source: S&P Dow Jones Indices
If that’s surprising to you, you’re not alone. As Chan and Lazarra point out, academics consider the long-term outperformance of low-risk portfolios as “perhaps the greatest anomaly in finance.”
So…what gives?
A big key to low-beta stocks’ success is what makes them designed for market messes like the one we’re trudging through now.
If a stock is inclined to move less than the S&P 500, that’s an advantage on the way down. It’s simple math. A stock that only loses 5% on the way down only has to gain 10% on the way up—that’s a much smaller hill to climb than the S&P 500 losing 10% on the way down and needing to rebound 20% to break even.
And that’s what you see with low-beta stocks.
Within that 28-year period, S&P looked at the 56 months during which the S&P 500 declined the most. The low-vol index outperformed 88% of the time, by an average of 2.85%. During the 112 best months, the low-vol index underperformed 82% of the time, and by a much smaller average of 1.70%.
All this reinforces the idea that if you have an itchy trigger finger and want to put your cash to work, low-beta stocks might be your best chance to get a bumper yield out of this stock-market dirt farm.
Here are five secure, boring dividend payers worth a closer look:
1. Spire
- Dividend Yield: 3.6%
- 5-Year Beta: 0.30
- 1-Year Beta: 0.10
Let’s make something abundantly clear: Utility stocks are the gold standard of low-beta stocks. Of the 20 names that have popped up on my research radar, 14—that’s 70%!—are utilities.
You can’t go anywhere near the sector without running into a few cool cucumbers.
As far as utility stocks go, Spire (NYSE:SR) isn’t exactly a household name the way Southern Co. (NYSE:SO) and Consolidated Edison (NYSE:ED) are. But it’s not exactly a minnow.
Spire is the fifth-largest publicly traded natural gas company in the U.S., serving 1.7 million customers across Alabama, Mississippi, and Missouri.
Spire stands out for its stability, both as a business and a stock.
More than 90% of its business mix is regulated utility activity (the remainder is gas marketing), which makes for extremely predictable revenues and income.
Currently, the company is targeting 5% to 7% earnings per share growth. A five-year, $3.1 billion capital expenditure plan should keep the company’s infrastructure up to date and help it to better accommodate customer growth.
Meanwhile, Spire has delivered 19 consecutive years of dividend growth. And even among utility stocks, SR shares are exceptionally calm. A 0.3 five-year beta and 0.1 one-year beta are both well below the sector average.
Admittedly, in 2022, Spire’s stock has been a little more feisty…but in the opposite direction of the S&P 500, racking up a 17% gain amid the market’s chaos.
When Investors Want Safety, They Seek Out Stocks Like Spire

2. Kellogg
- Dividend Yield: 3.4%
- 5-Year Beta: 0.48
- 1-Year Beta: 0.05
Consumer staples are another popular go-to for those looking for some safety and stability, and Kellogg (NYSE:K) certainly hasn’t disappointed.
Kellogg Shares During a Market Downturn? They’re Grrrrrreat!

You’re sure to know Kellogg because of its many ubiquitous cereal brands: Frosted Flakes, Froot Loops, Honey Smacks, Apple Jacks, and Frosted Mini-Wheats are among its top names.
But it’s more than just cereal—it’s a total breakfast powerhouse, boasting Bear Naked granola, Eggo waffles and Nutri-Grain bars. On top of that, it has a few snacks in Cheez-Its and Club crackers, even Morningstar Farms vegan and vegetarian foods.
While most other companies are whiffing on earnings expectations of late, Kellogg has been busy smacking them down. Revenues and organic sales for Q1 both easily topped estimates.
Cost inflation caused earnings to dip less than 1%, but that was still much better than expected. Outlooks were similar, with Kellogg raising sales estimates while keeping profit forecasts level.
That doesn’t sound stellar, but it’s great news in the current environment—and in a way, it should be expected given that staples companies are better able than most to pass on their costs to consumers.
In the meanwhile, Kellogg is working on its 18th consecutive year of dividend hikes—though it should be noted that payout growth has flattened significantly in recent years. The most recent increase was a stingy 1.7% improvement. We want to see much better than that in our long-term holdings.
3. Newmont
- Dividend Yield: 3.3%
- 5-Year Beta: 0.36
- 1-Year Beta: 0.17
Gold and copper miner Newmont Goldcorp (NYSE:NEM) puts something of a wrench in the idea of targeting low beta alone.
Newmont, which boasts the largest gold reserves in the world at 96 million ounces, has operations in the U.S., Mexico, and Canada, and on three other continents. In addition to being the global gold leader, it also produces copper, silver, zinc and lead.
Gold is often considered a big hedge against inflation, as well as equity volatility, so it’s no wonder that Newmont has held up really well in 2022, up nearly 10% to the S&P 500’s 16% declines.
But it’s also an example of how low beta doesn’t always equal low volatility—at least not the way that you and I think of it.
Most stocks tend to sway in the general direction of the broader market to some extent—and in those cases, a low beta simply means the stock just doesn’t wiggle as much as the S&P 500 does.
But some stocks can also have a low beta by simply marching to the beat of its own drum. Newmont, for instance, is a lot more likely to be affected by gold prices than what the S&P 500 is doing on a given day.
Case in point?
Does Newmont Look Calm to You?

That doesn’t mean Newmont isn’t a great defensive play—it is, as long as you expect that at the same time equities are broadly being dragged lower, gold will be lifted even higher. But despite what the low beta might indicate, you shouldn’t expect a smooth ride with NEM.
4. Amcor
- Dividend Yield: 3.3%
- 5-Year Beta: 0.34
- 1-Year Beta: 0.07
Another out-of-the-ordinary safety pick is Amcor (NYSE:AMCR)—technically in the materials sector, though it’s tied tight to consumer companies.
Amcor makes packaging. Just about any kind you can think of. Liquid bottles of every size and shape you can imagine. Shelf-stable packaging for ready-to-eat meals. Shrink bags for deli eats. Lidding films for pudding cups. Custom caps for wine and liquor bottles.
Amcor has faced its own difficulties in 2022—Truist analysts note that the company is currently reformulating many of its packaging products away from materials that are prone to shortages.
But many of its categories (beverages, healthcare, pet food, coffee and more) are seeing so much strength that the company lifted the bottom part of its full-year earnings guidance—at the midpoint, it’s looking to grow its bottom line by low double digits.
That optimism has been rewarded of late.
Investors Want What Amcor Is Bottling Up

Amcor also caters to long-term buy-and-holders who value dividend growth—it’s a Dividend Aristocrat with nearly four decades of uninterrupted payout raises under its belt. (Amcor “bought” that membership via the purchase of former Aristocrat Bemis in 2020, but it so far seems committed to the cause.)
5. Safety Insurance Group (SAFT)
- Dividend Yield: 4.2%
- 5-Year Beta: 0.35
- 1-Year Beta: 0.30
Investors in financial sector have been let down hard in 2022. Rising interest rates were supposed to prop up margins at banks, brokers and insurers—and to be fair, they’ll still have a positive impact—but worries that the Fed’s tightening will grind the economy to a halt have nonetheless weighed hard on the sector.
So instead of being the Wall Street darling everyone expected them to be, financials are off double digits so far this year.
However, insurers such as Safety Insurance Group (NASDAQ:SAFT) have been a pleasant exception.
The Relative Strength Is Strong In This One

Safety Insurance Group is an A.M. Best “A”-rated insurer that provides auto, home and business owner’s insurance in Maine, Massachusetts, and New Hampshire.
Specifically, a little more than half its 2021 direct written premiums were private passenger automobile insurance; homeowners policies were another quarter; property and casualty (including commercial automobile) were 16%; and dwelling, umbrella and business owner properties made up the rest.
Insurers in general should be expected to hold up well, given that their fortunes aren’t as connected to the strength of economic activity as, say, commercial banks. But SAFT dwells in particularly smooth waters, reflecting a pretty stable top line for an insurer.
My big issue here is dividend growth, which has stalled out completely; the dividend has been stuck at 90 cents quarterly since 2019.
Disclosure: Brett Owens and Michael Foster are contrarian income investors who look for undervalued stocks/funds across the U.S. markets. Click here to learn how to profit from their strategies in the latest report, "7 Great Dividend Growth Stocks for a Secure Retirement."