🔮 Better than the Oracle? Our Fair Value found this +42% bagger 5 months before Buffett bought itRead More

3i Stock Selloff Stopped By Fibonacci Support Level

Published 04/02/2020, 08:25 AM
Updated 07/09/2023, 06:31 AM
TGOPY
-

3i (OTC:TGOPY) stock was hovering around 1100 pence per share when we wrote about it in late-October 2019. The stock was up almost 1000% in ten years and few thought it was vulnerable to a significant decline. That was five months ago – before the coronavirus pandemic and the global stock market crash it triggered.

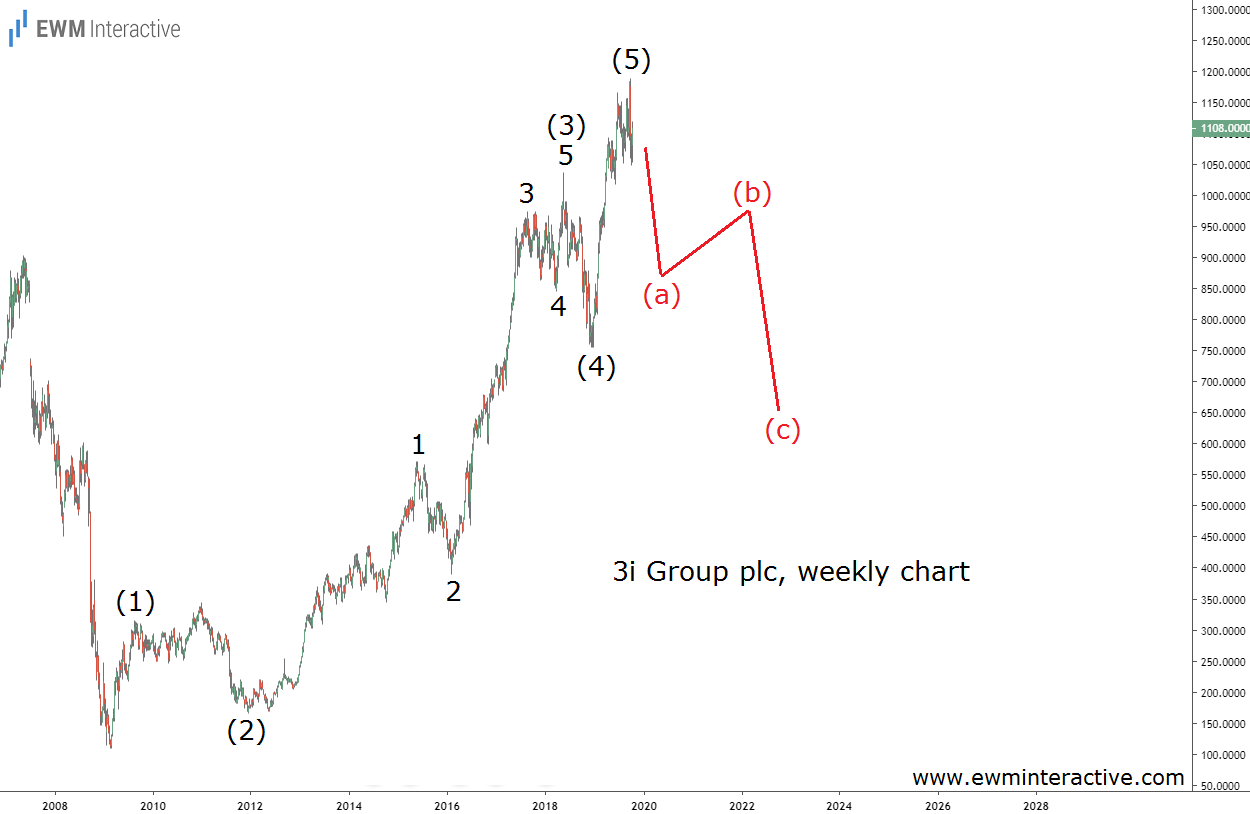
But instead of simply extrapolating the 3i’s past performance into the future, we chose a different route. Our Elliott Wave analysis of the stock’s weekly chart revealed a worrying picture. Take a look at it below to refresh your memory.
3I Group Weekly Chart

A quick look at 3i stock ‘s weekly chart revealed a textbook five-wave impulse from the bottom in March 2009. The pattern was labeled (1)-(2)-(3)-(4)-(5), where the five sub-waves of wave 3 were visible, as well. According to the theory, a three-wave correction follows every impulse.

3i Stock Erased Four Years of Gains in just a Month

So instead of joining the bulls near 1100, we decided to “observe from a safe distance” in anticipation of at least a 35% drop. Fifth waves are usually fully retraced by the following correction, so we thought the support near 700 was a reasonable bearish target. Little did we know that this estimate was too optimistic.
3I Weekly Chart

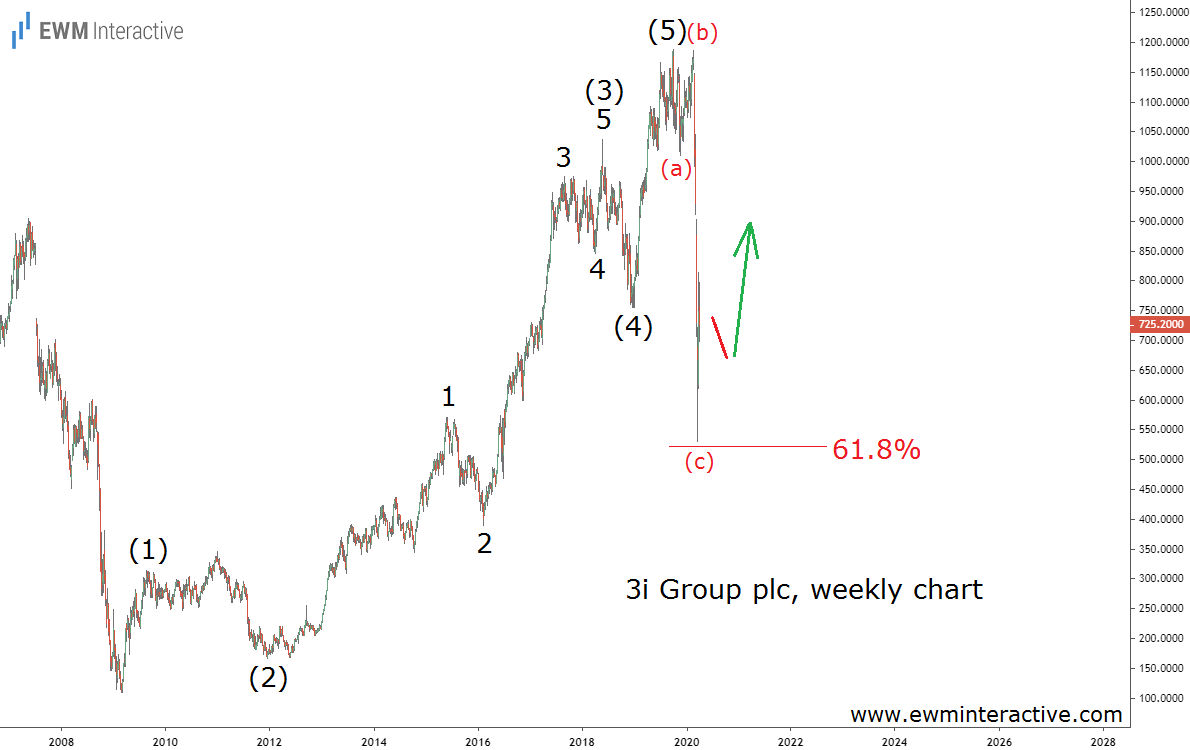
3i stock held above 1000 for a while until mid-February when investors realized COVID-19 was more than just a Chinese problem. A month later, on March 18th, the price touched 530 pence a share. From top to bottom, shareholders lost 55.4%. And while the pandemic came totally out of the blue, the Elliott Wave stage for this crash was set months earlier.

What is interesting is that the bears seem to have given up precisely at the 61.8% Fibonacci support level. The decline from 1189 can be seen as a complete (a)-(b)-(c) zigzag. This means the entire 5-3 wave cycle from the 2009 bottom is also complete.

If this count is correct, the price can be expected to move in the direction of the impulse pattern from here. In the long-term, the bulls should be able to lift 3i stock to 1200 and beyond.

Original Post

Latest comments

Loading next article…
Risk Disclosure: Trading in financial instruments and/or cryptocurrencies involves high risks including the risk of losing some, or all, of your investment amount, and may not be suitable for all investors. Prices of cryptocurrencies are extremely volatile and may be affected by external factors such as financial, regulatory or political events. Trading on margin increases the financial risks.
Before deciding to trade in financial instrument or cryptocurrencies you should be fully informed of the risks and costs associated with trading the financial markets, carefully consider your investment objectives, level of experience, and risk appetite, and seek professional advice where needed.
Fusion Media would like to remind you that the data contained in this website is not necessarily real-time nor accurate. The data and prices on the website are not necessarily provided by any market or exchange, but may be provided by market makers, and so prices may not be accurate and may differ from the actual price at any given market, meaning prices are indicative and not appropriate for trading purposes. Fusion Media and any provider of the data contained in this website will not accept liability for any loss or damage as a result of your trading, or your reliance on the information contained within this website.
It is prohibited to use, store, reproduce, display, modify, transmit or distribute the data contained in this website without the explicit prior written permission of Fusion Media and/or the data provider. All intellectual property rights are reserved by the providers and/or the exchange providing the data contained in this website.
Fusion Media may be compensated by the advertisers that appear on the website, based on your interaction with the advertisements or advertisers.
© 2007-2024 - Fusion Media Limited. All Rights Reserved.