The basic materials sector was the real losing sector this year. Basic materials stocks down 2.6 percent overall this year while the best performing sector, healthcare stocks, gained 24.3 percent.
But not all basic materials stocks are down. There are stocks that doubled in price since the beginning of this year. Others are up 50 percent. Below, you can find a small list of the 20 top basic materials stocks. I excluded all companies with a market capitalization below USD 300 million and those without a dividend.
The 20 top dividend paying results gained from 44.58 percent to 65.14 percent. Three of the results have a market cap below a billion and additional seven are valuated between one or two billion. Small and mid-cap stocks are the main performance driver of the sector. Despite the strong stock price hikes, fourteen companies still have a buy or better rating.
Hi-Crush Partners (HCLP) has a market capitalization of $612.85 million. The company generates revenue of $75.63 million and has a net income of $43.53 million. The firm’s earnings before interest, taxes, depreciation and amortization (EBITDA) amounts to $48.98 million. The EBITDA margin is 64.76 percent (the operating margin is 62.17 percent and the net profit margin 57.55 percent). Shares of HCLP are up 56.73 percent this year.
Financial Analysis: The total debt represents 0.00 percent of the company’s assets and the total debt in relation to the equity amounts to 0.00 percent. Due to the financial situation, a return on equity of 82.54 percent was realized. Twelve trailing months earnings per share reached a value of $2.79. Last fiscal year, the company paid $0.71 in the form of dividends to shareholders. Forward P/E: 8.17.
Market Valuation: Here are the price ratios of the company: The P/E ratio is 8.04, the P/S ratio is 8.10 and the P/B ratio is finally 6.44. The dividend yield amounts to 8.46 percent and the beta ratio is not calculable.
Pioneer Southwest Energy Partners (PSE) has a market capitalization of $1.29 billion. The company employs 3,667 people, generates revenue of $208.29 million and has a net income of $107.56 million. The firm’s earnings before interest, taxes, depreciation and amortization (EBITDA) amounts to $133.13 million. The EBITDA margin is 63.92 percent (the operating margin is 52.28 percent and the net profit margin 51.64 percent). Shares of PSE are up 65.14 percent this year.
Financial Analysis: The total debt represents 29.24 percent of the company’s assets and the total debt in relation to the equity amounts to 48.16 percent. Due to the financial situation, a return on equity of 43.92 percent was realized. Twelve trailing months earnings per share reached a value of $3.10. Last fiscal year, the company paid $2.07 in the form of dividends to shareholders. Forward P/E: 12.68.
Market Valuation: Here are the price ratios of the company: The P/E ratio is 11.61, the P/S ratio is 6.17 and the P/B ratio is finally 4.92. The dividend yield amounts to 5.78 percent and the beta ratio has a value of 0.57.
Aceto Corporation (ACET) has a market capitalization of $394.36 million. The company employs 233 people, generates revenue of $444.39 million and has a net income of $16.98 million. The firm’s earnings before interest, taxes, depreciation and amortization (EBITDA) amounts to $33.95 million. The EBITDA margin is 7.64 percent (the operating margin is 5.71 percent and the net profit margin 3.82 percent). Shares of ACET are up 44.58 percent this year.
Financial Analysis: The total debt represents 15.29 percent of the company’s assets and the total debt in relation to the equity amounts to 27.24 percent. Due to the financial situation, a return on equity of 10.33 percent was realized. Twelve trailing months earnings per share reached a value of $0.77. Last fiscal year, the company paid $0.20 in the form of dividends to shareholders. Forward P/E: 14.26.
Market Valuation: Here are the price ratios of the company: The P/E ratio is 18.80, the P/S ratio is 0.89 and the P/B ratio is finally 2.31. The dividend yield amounts to 1.53 percent and the beta ratio has a value of 1.13.
Take a closer look at the full list of the best performing basic material dividend stocks. The average P/E ratio amounts to 34.02 and forward P/E ratio is 21.87. The dividend yield has a value of 4.65 percent. Price to book ratio is 3.87 and price to sales ratio 6.06. The operating margin amounts to 22.80 percent and the beta ratio is 0.96. Stocks from the list have an average debt to equity ratio of 4.62.
Here is the full table with some fundamentals (TTM): 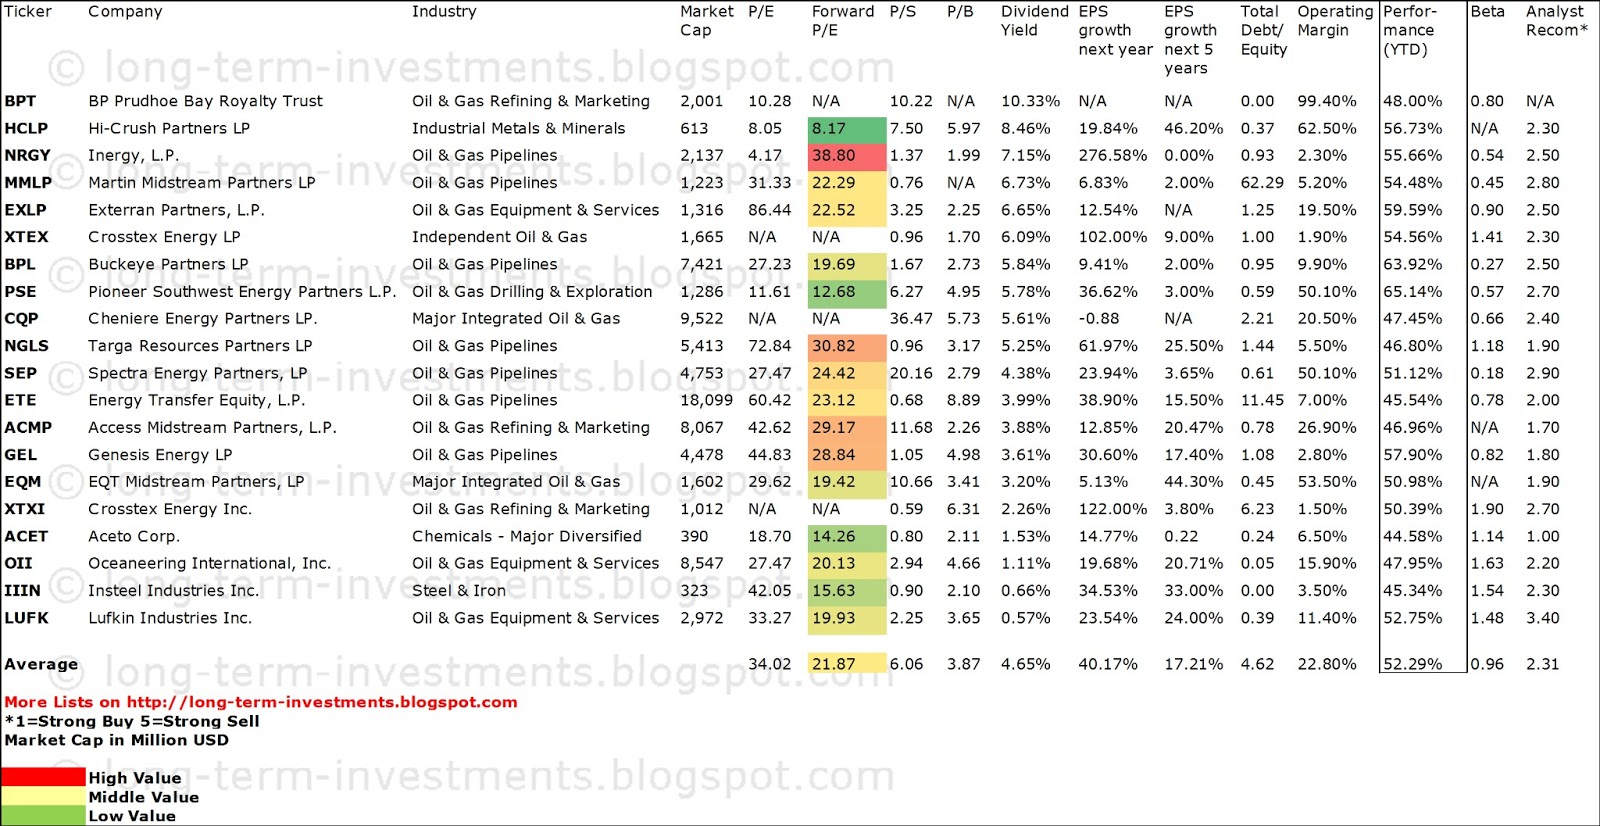
Related stock ticker symbols:
BPT, HCLP, NRGY, MMLP, EXLP, XTEX, BPL, PSE, CQP, NGLS, SEP, ETE, ACMP, GEL,
EQM, XTXI, ACET, OII, IIIN, LUFK
- English (UK)
- English (India)
- English (Canada)
- English (Australia)
- English (South Africa)
- English (Philippines)
- English (Nigeria)
- Deutsch
- Español (España)
- Español (México)
- Français
- Italiano
- Nederlands
- Português (Portugal)
- Polski
- Português (Brasil)
- Русский
- Türkçe
- العربية
- Ελληνικά
- Svenska
- Suomi
- עברית
- 日本語
- 한국어
- 简体中文
- 繁體中文
- Bahasa Indonesia
- Bahasa Melayu
- ไทย
- Tiếng Việt
- हिंदी
20 Highest Yielding Basic Materials Stocks On An Uptrend
Published 07/14/2013, 03:20 AM
Updated 07/09/2023, 06:31 AM
20 Highest Yielding Basic Materials Stocks On An Uptrend
3rd party Ad. Not an offer or recommendation by Investing.com. See disclosure here or
remove ads
.
Latest comments
Install Our App
Risk Disclosure: Trading in financial instruments and/or cryptocurrencies involves high risks including the risk of losing some, or all, of your investment amount, and may not be suitable for all investors. Prices of cryptocurrencies are extremely volatile and may be affected by external factors such as financial, regulatory or political events. Trading on margin increases the financial risks.
Before deciding to trade in financial instrument or cryptocurrencies you should be fully informed of the risks and costs associated with trading the financial markets, carefully consider your investment objectives, level of experience, and risk appetite, and seek professional advice where needed.
Fusion Media would like to remind you that the data contained in this website is not necessarily real-time nor accurate. The data and prices on the website are not necessarily provided by any market or exchange, but may be provided by market makers, and so prices may not be accurate and may differ from the actual price at any given market, meaning prices are indicative and not appropriate for trading purposes. Fusion Media and any provider of the data contained in this website will not accept liability for any loss or damage as a result of your trading, or your reliance on the information contained within this website.
It is prohibited to use, store, reproduce, display, modify, transmit or distribute the data contained in this website without the explicit prior written permission of Fusion Media and/or the data provider. All intellectual property rights are reserved by the providers and/or the exchange providing the data contained in this website.
Fusion Media may be compensated by the advertisers that appear on the website, based on your interaction with the advertisements or advertisers.
© 2007-2024 - Fusion Media Limited. All Rights Reserved.