Before I move forward into summarising the outlook for other asset classes, I would like to further go into the US equity market outlook. My personal opinion is that there is too much complacency right now and this is usually how markets top out. This is especially true after a four year super run such as we've experienced since March 2009.
Let me present 16 sentiment indicators I track to explain why I do not want to be anywhere near equities right now. Since there are a lot of charts to cover, I will keep it all in point form. Furthermore, apologies in advance if any of the material overlaps from previous posts.
Chart 1: Low volume is usually a sign of distribution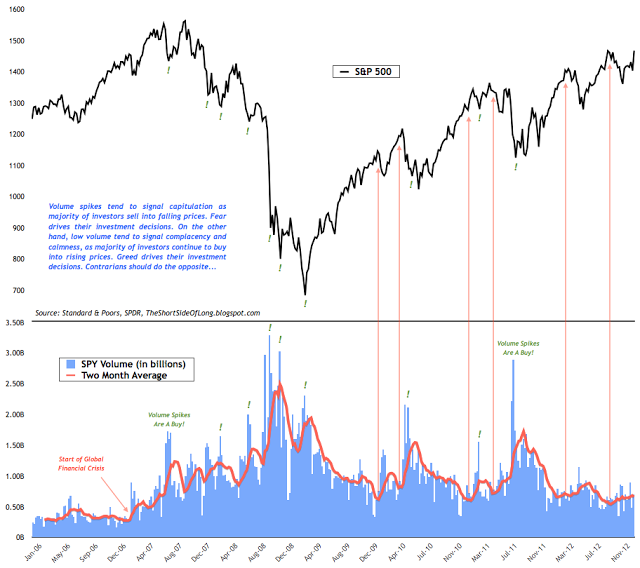
- Low volume is usually a sign of distribution, where smart money is slowly selling into strength as retail money is buying. As long as the volatility is low, the media news is bullish and trend is upward - retail money is not spooked and keeps accumulating. In my opinion, distribution has been in progress since at least March 2012.
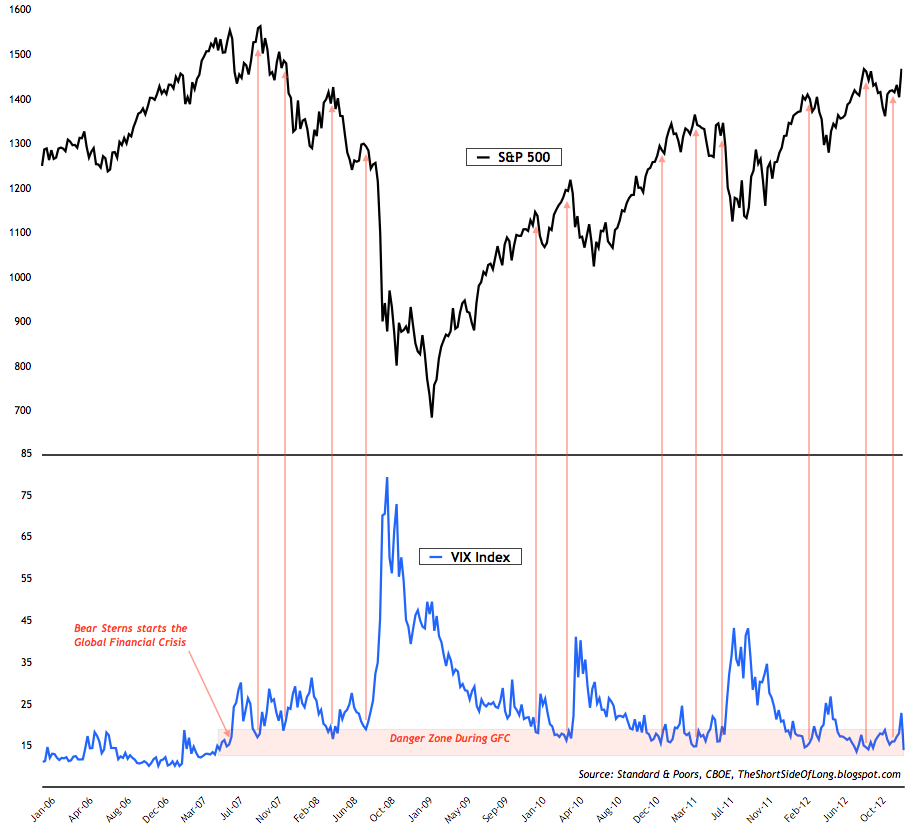
- VIX is once again in the so called "danger zone", which usually indicates a top is either at hand or near. But it is not just equity volatility that remains very low. Consider the following chart:
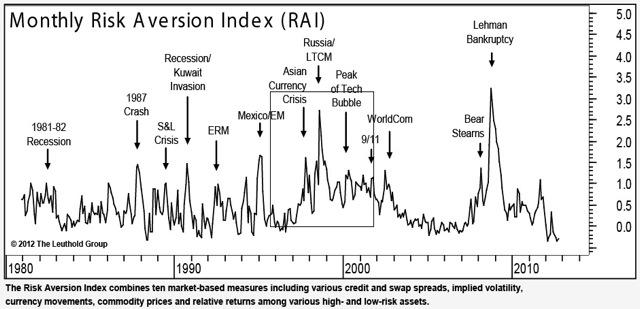
- Volatility is extremely low across all asset classes as investors hold high confidence that both the economy and financial markets will continue to deliver for quarters and years to come. JPMorgan’s G7 Volatility Index of currencies fell to a record low reading of 7 in late December. Furthermore, Merrill Lynch’s MOVE Index covering Treasuries fell almost 40 percent from its high last year.
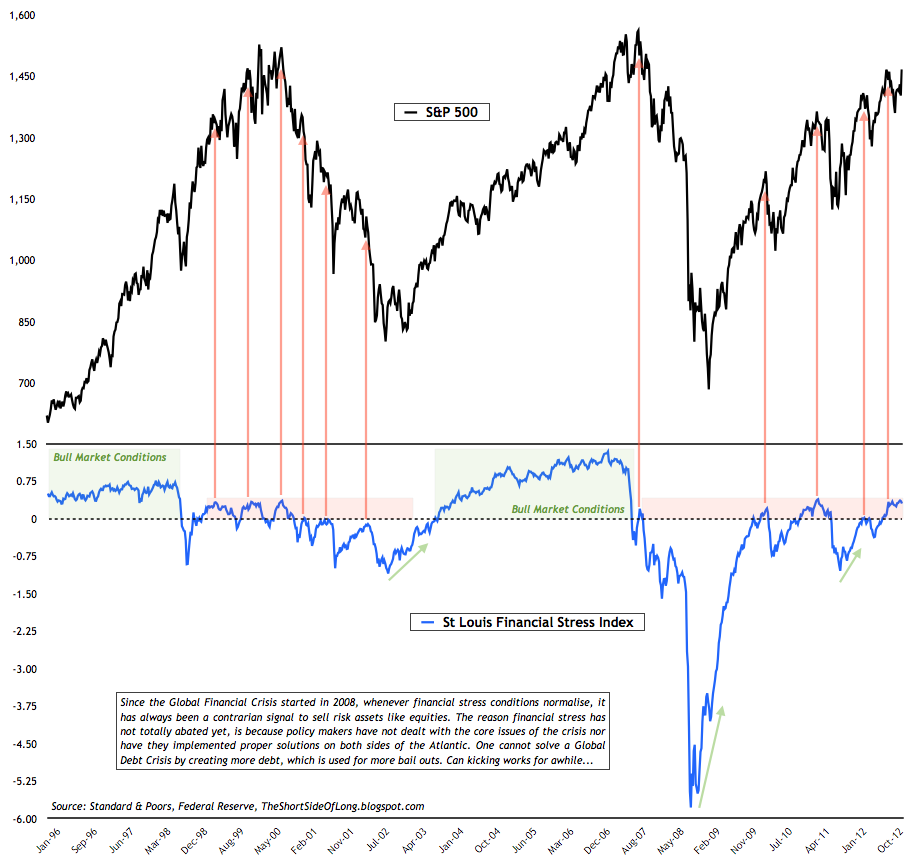
- Just like the VIX, the Fed's Financial Stress Index is at a very low level (inverse on the chart above). Last time we saw a similar reading was just prior to the 2010 flash crash and the 2011 sell off I believe something similar is in the cards once again.
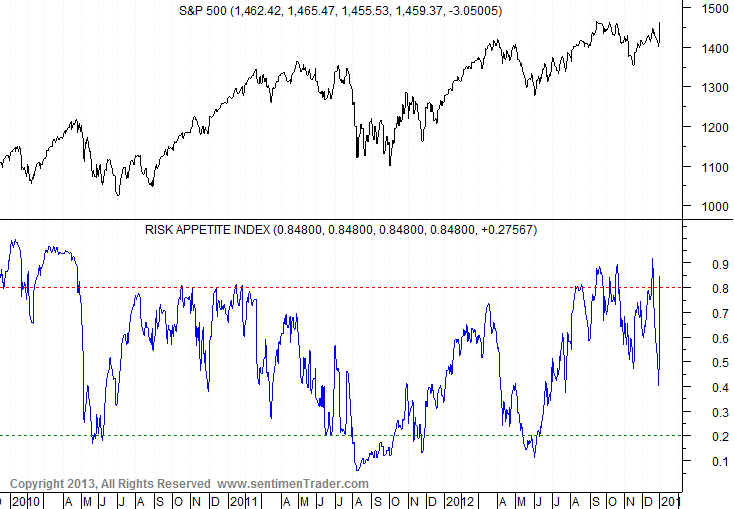
- During such low volatility, it is only natural that complacency and high risk taking appetite flourishes. If this was a solid economic expansion, like the business cycles we saw during the 1980s and 1990s, than one could make a point that usually these conditions could go on for a lot longer. However, we are currently in a secular equity bear market and in a period of de-leverging were constant shocks are very common. It is not wise to be bullish when the herd is in love with risk.
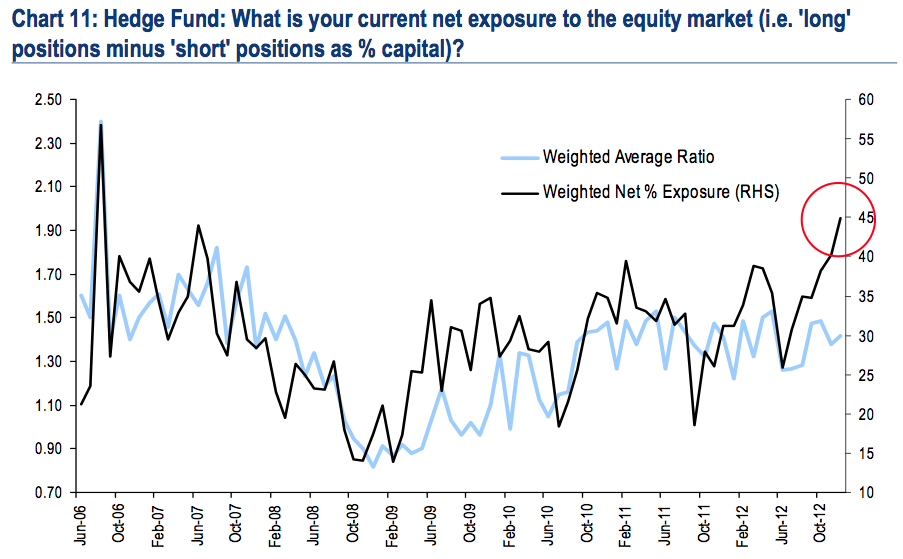
- The Merrill Lynch research team writes: "Hedge fund net exposure to equities jumped to its highest level [in years] (net 45%). More broadly, the % of investors who say they are taking higher-than-normal risk in their portfolio is now highest since Apr’11." Exposure is as high as September 2007, while risk taking is as high as April 2011 - both of which marked very important equity tops over the last half decade.
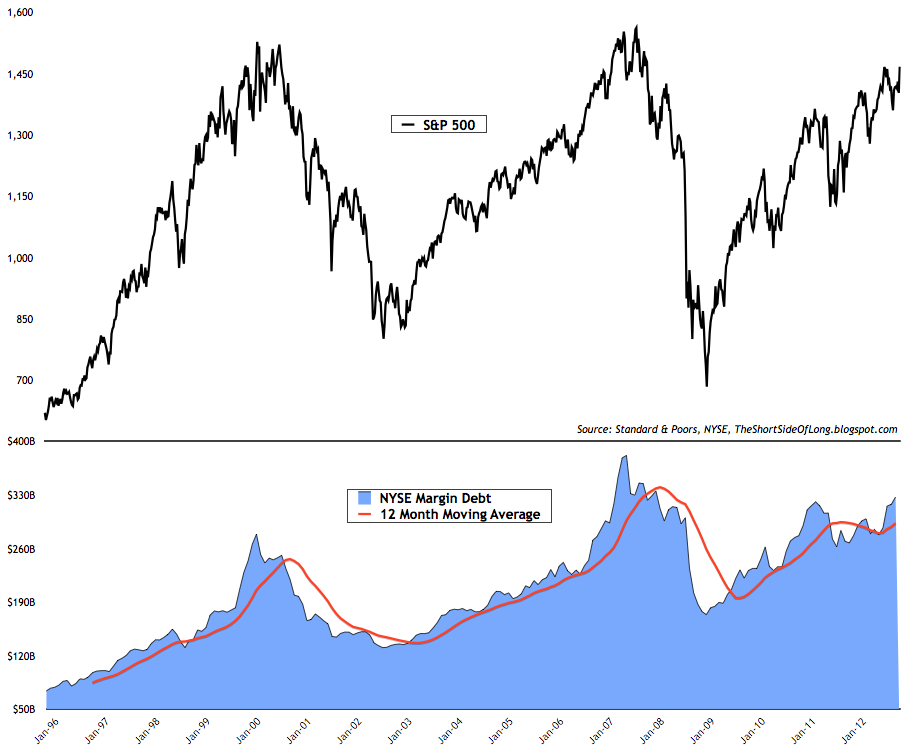
- According to the new data released by the NYSE, margin debt levels grew to 326.99 billion dollars. This is the highest reading since the bull market began in March 2009, when market participants held only 182.16 billion dollars. So in other words, as the market has doubled in price, so has the exposure and leverage. While not as high as the readings seen during the middle of 2007 ($381 billion), we are definitely not too far off. Speculation, leverage and over-exposure are definitely alive and well.
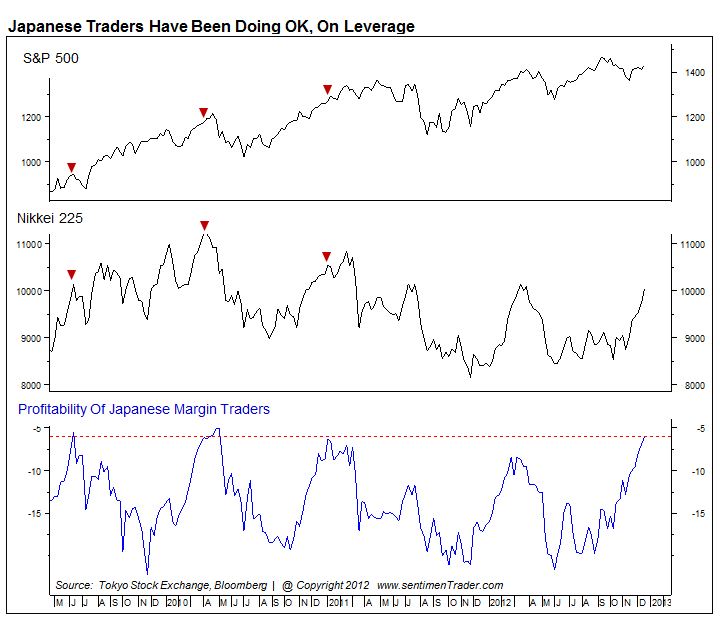
- Speculation, leverage and over-exposure aren't only present in the US markets, but also elsewhere around the world. The chart above shows a great indicator, constructed by the Sentiment Trader service, which tracks Japanese retail investors as a contrary indicator. When ever probability reaches higher thresholds, it is usually a sign of a market top as exposure and leverage are heavily increased. What follows is a correction shake out.
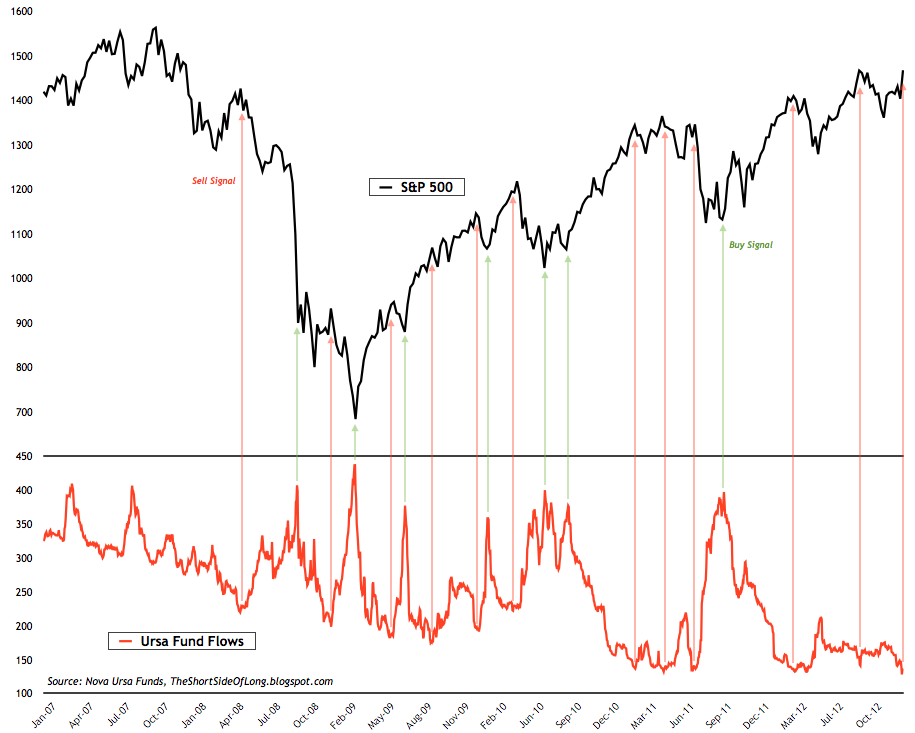
- Rydex traders are known as dumb money and in the chart above we can definitely see why. These traders tend to accumulate large short bets just before a market bottom and remain extremely complacent just prior to a market top. Interestingly enough, last week we saw record low exposure in the Ursa fund, which Rydex traders use in order to short sell the S&P 500. Previous instances have marked an intermediate top of some kind, however since bearish interest has been non-existent for such a long period (necessary to create a wall of worry), it is possible that we are putting in a major top right now.
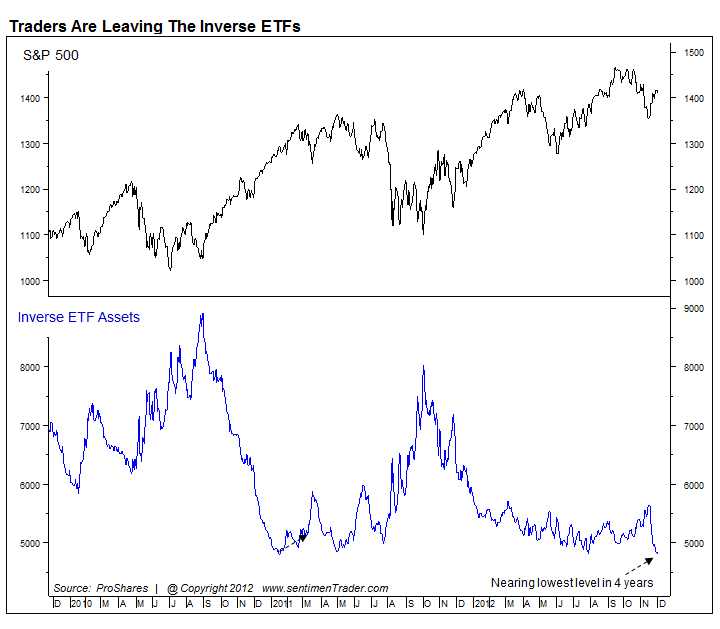
- It seems that Rydex traders aren't the only complacent group of investors. In the recent SentimenTrader update on Inverse ETF exposure, which tends to be very popular amongst retail investors, we saw that exposure is at the lowest levels seen in at least four years. This indicator has done a great job giving us contrary signals on both the bullish and the bearish side, so the current on-going complacency by the retail crowd will most likely mark a top when viewed in hindsight.
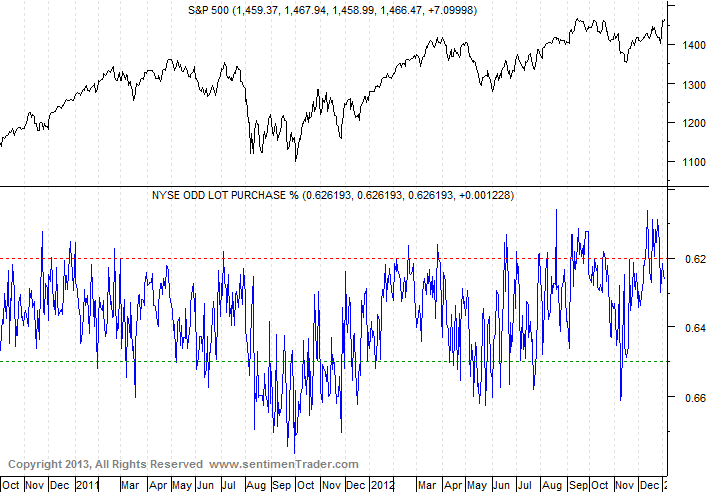
- According to the NYSE data, complained by the SentimenTrader service, small traders and other retail investors are highly bullish on the stock market as they engage into minimal shorting activity. As a contrary indicator, this is signalling at most likely a top is either here or close by.
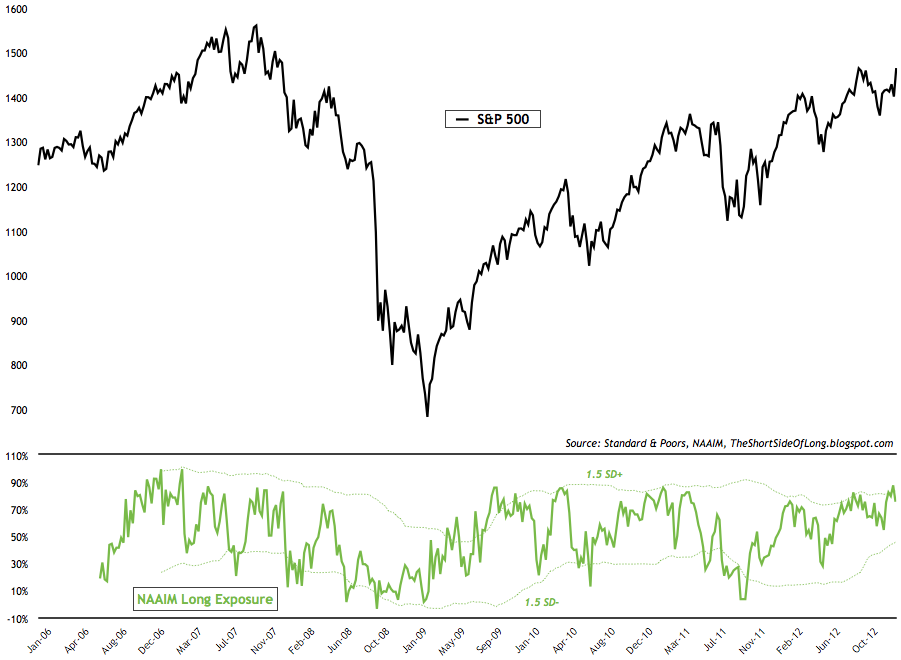
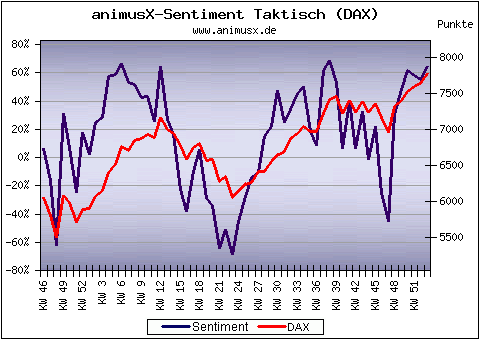
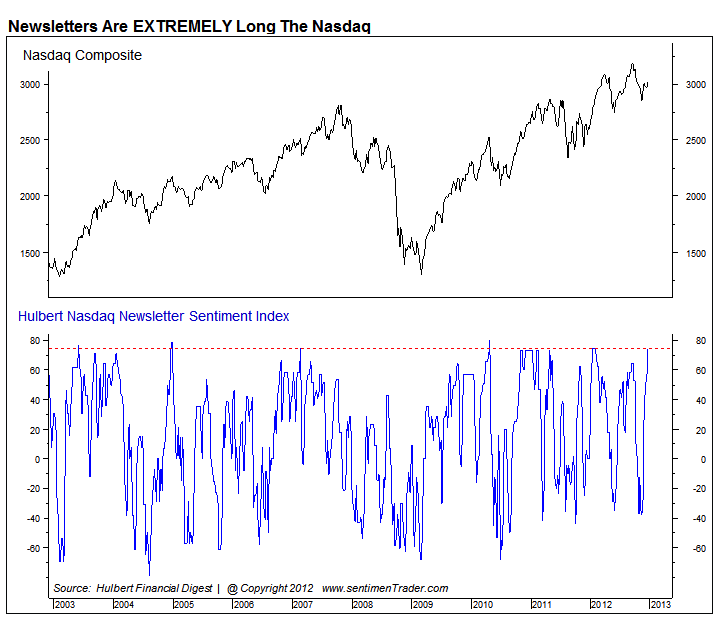
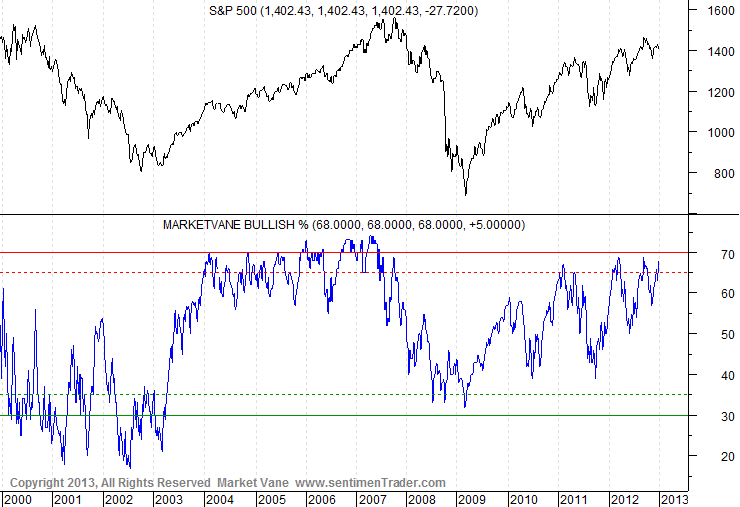
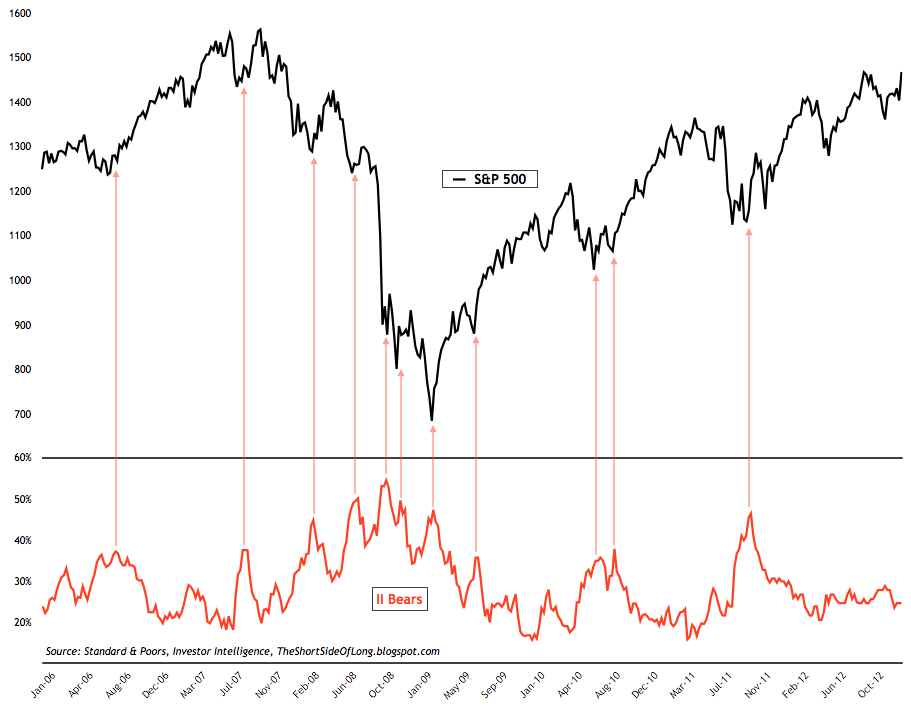
- A large number of sentiment surveys are indicating that a top is near. Some surveys show high bullish readings or extreme long exposure, while others show a prolonged period of complacency which usually signals risk off around the corner.
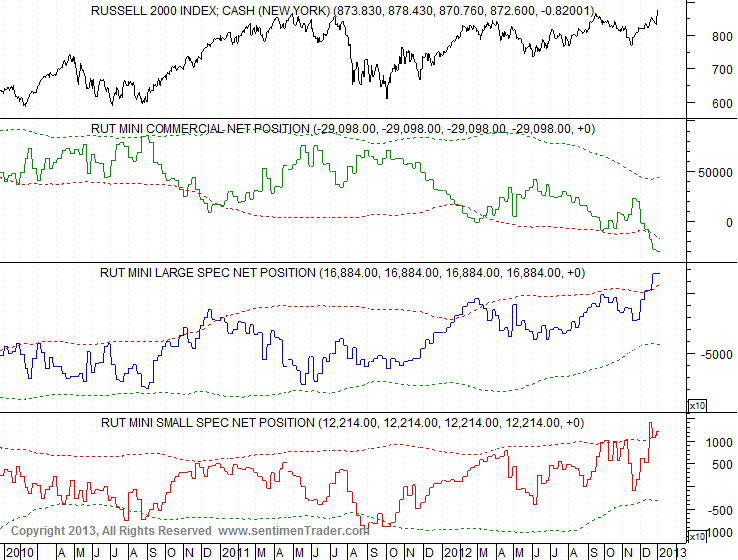
- According to the recent CFTC Commitment of Traders report, hedge funds and other small speculators are piling into the more speculative Russell 2000 small cap index. Previous instances where we saw similar exposure was during late parts of 2010, early parts of 2012 and in September of 2012. All of them marked some type of a intermediate top, however this time around... hedge funds have gone to absolute extreme levels.
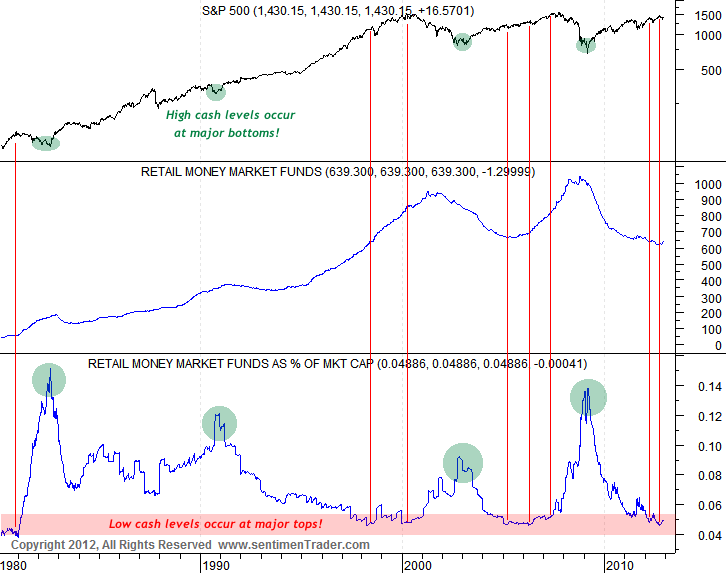
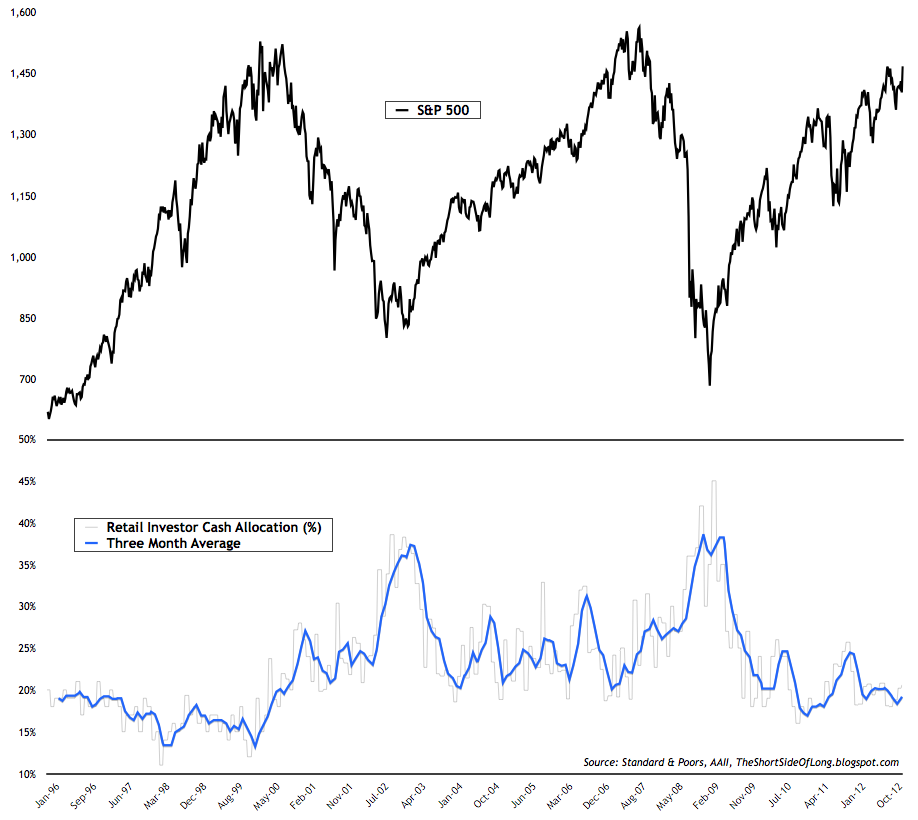
- Low cash levels in retail money market funds, Rydex funds, AAII retail investor survey, ICI mutual funds, various hedge fund reports and many other indicators all signal that complacency is currently the main condition within the markets. Usually, when cash levels remain at low levels for a prolonged period of time and equity prices do very well over multi year patterns, the next major event is a downtrend or a bear market (especially during secular bearish trends).
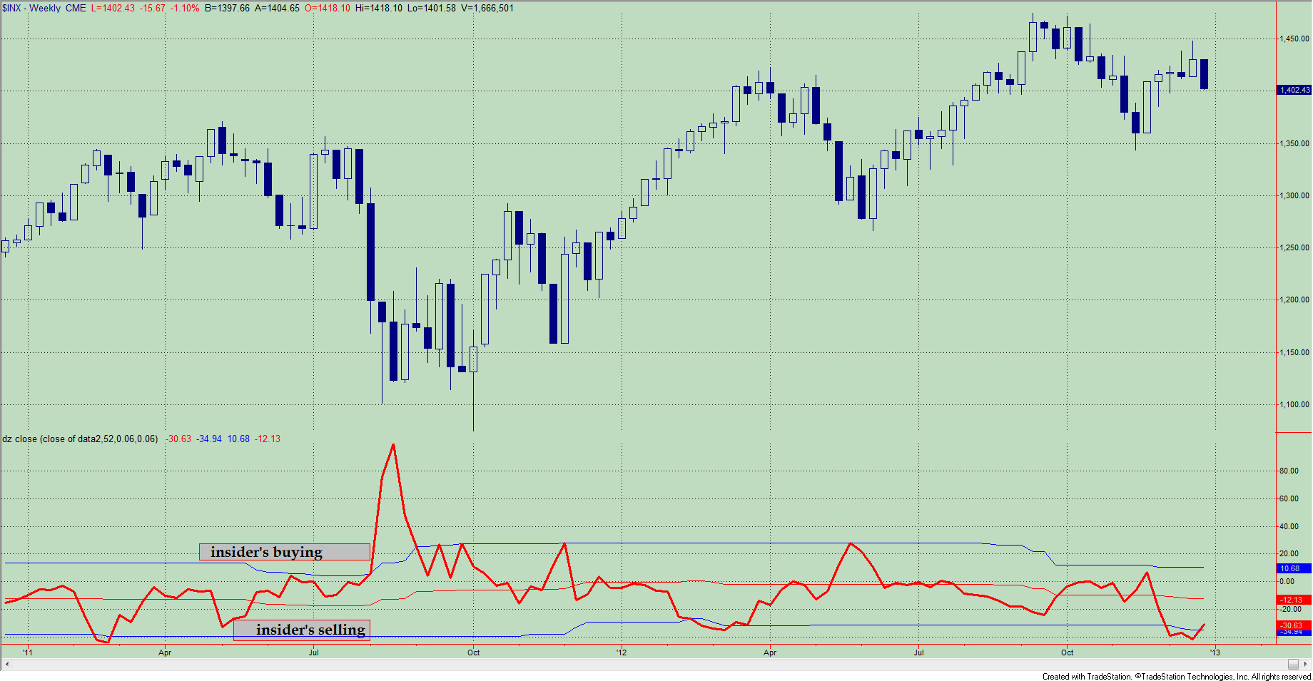
- It seems that corporate insiders, whose knowledge on corporate earnings is always far better than the rest of the Wall Street strategists, are currently extremely bearish on stocks. Previous times we saw similar patterns was in February 2011, March 2012 and right now. The first two signalled an important intermediate top and a correction of at least 10% to 15%. I expect that this time won't be different.
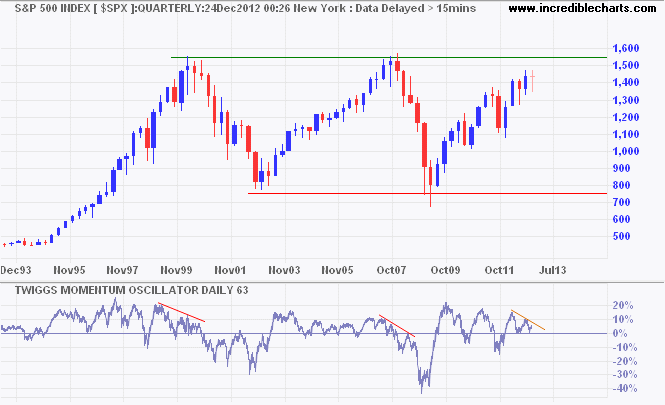
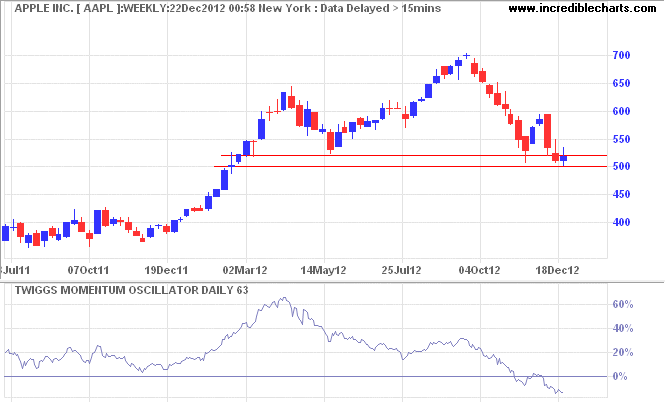
- In his recent weekly update, a well respected Australian trader by the name of Colin Twiggs stated the following: "Quarterly charts for the last two decades give a good idea of where stocks will be headed in 2013. The S&P 500 is headed for a test of its 2000/2007 high at 1550. Declining 63-day Twiggs Momentum indicates that resistance is unlikely to be broken. While this does not mean another fall to 750, it does suggest a strong correction. Apple Inc. [AAPL] is no longer leading the advance but testing primary support at 500. Failure of support would confirm the primary down-trend indicated by a 63-day Twiggs Momentum peak below zero." All in all, while stocks might move higher by several percentage points at best, I tend to agree with Colin that a downside risk is much greater. A bear market towards the middle of the decade long trading range (1550 and 750) in the coming quarters and years would not surprise me at all.
