I know you have something better to do this week…
Given that I was the only neighbor to have their garbage curbside this week, I know that few are thinking about work or the financial markets. This is good news because unless you invest solely in Healthcare, Consumer, Financial or Momentum stocks, then your portfolio likely smells like my garbage can. oil and gold stocks could even use my trash bags as an air freshener.
Oceans, lakes and mountains are what stock investors should be enjoying right now as several issues are affecting market psychology. Oil and commodity prices continue to evaporate along with the growth outlooks for the Emerging Markets combined with the strengthening dollar. Junk and BBB credit spreads continue to widen. Leadership in the market is continuing to narrow and focus on a select group of Momentum sectors and stocks. And even the U.S. IPO market is starting to bring out its own version of garbage as it recycles past LBOs and unprofitable, weak new business models. But the VIX is back to a 12 handle so all must be well, right?
Seriously, it’s the first week of August, focus on your paddle stroke; there will be opportunities in the market later in the month.
A good summary of last week…
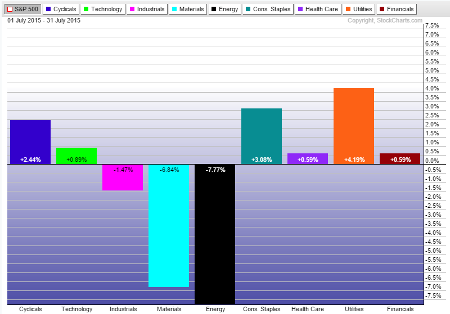
U.S. equities finished higher this week following one of the bigger weekly pullbacks of 2015 in the week prior. Earnings continued to get most of the attention. However, there was little change surrounding higher-profile themes such as the negative spillover effects from oil, sluggish capex trends, FX headwinds, emerging market/China weakness, restructuring, expense control, lower input costs, and pockets of consumer strength. This week also saw some continued traction behind the M&A, shareholder activism and strategic actions themes, and there was a good deal of volatility surrounding the latest macro developments. Much of the focus was on the seemingly conflicting takeaways for the September vs. December liftoff debate from the FOMC statement and Q2 GDP and ECI data. China remained under scrutiny with the renewed selling pressure in equities and debate about the extent to which its economic slowdown should impact global growth and commodity sentiment. There were some mixed read-throughs for risk and recovery sentiment from both the latest flow data and sector performance. The utilities sector was the best performer, posting its biggest weekly gain in over four months; a few cyclical/momentum plays rebounded following last week’s scrutiny, and energy was the only sector to finish lower with another sell-off in oil.
One of the more interesting events happened Friday when the Employment Cost Index put up a weak print. But the Fed’s Bullard was quick to dismiss the ECI data in exchange for the strong GDP print. So, is a September FOMC rate increase still on the table?
Federal Reserve Bank of St. Louis President James Bullard said Friday economic data seen since central bankers gathered this week are bolstering the case for raising short-term rates when officials meet in September. “We are in good shape” for increasing the Fed’s currently near-zero short-term rate target at the Sept. 16-17 central bank gathering, Mr. Bullard said in an interview with The Wall Street Journal. He said officials needed to see how growth data released Thursday shaped up before clearing the way to act. Mr. Bullard shrugged off a report Friday showing surprising tepid wage gains, saying he isn’t that worried about the situation right now… “I thought the GDP data was confirmation” of the healthy outlook that lies ahead of the U.S., Mr. Bullard said. “I’m not going to put as much weight on the wage data,” which on a longer-run trend basis is pretty much where he expected it would be given inflation and productivity factors, he said.
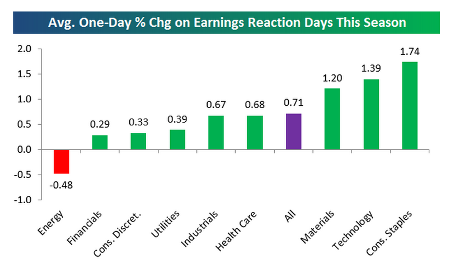
Another reason for vacation time for many participants was the end of peak earning season. And for those investors/traders long into the number, it was a great earnings season…
A total of 1,370 companies have now reported their second quarter earnings numbers this season. Below is a look at how stock prices have responded to these reports by sector. We took every stock that has reported this season and grouped them by sector. We then calculated the one-day percent change that each stock experienced on its earnings reaction day (the first trading day following the report), and then took the average for each sector. As shown below, for all stocks that have reported earnings this season, the average one-day change in response was a gain of +0.71%. So the average stock that has reported has gained more than two-thirds of a percent on its earnings reaction day.
For the week, Energy and Materials saw a further thrashing while Utilities bounced with Treasuries…
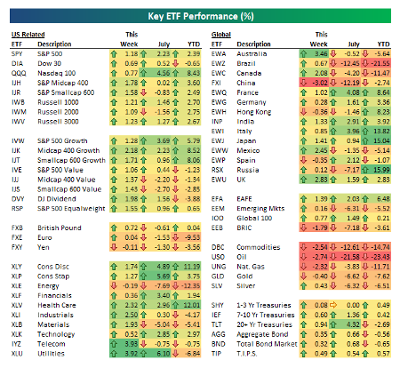
With July 2015 in the books, it is a good time to look at Bespoke’s easy to read color coded performance charts to tell you where the market momentum has been:
Top Momentum: Nasdaq 100, Small/Midcap Growth, Consumer Discretionary, Healthcare, Japan, Italy, EAFE.
Anti-Momentum: Euro, Energy, Brazil, Emg Markets, Commodities, Oil.
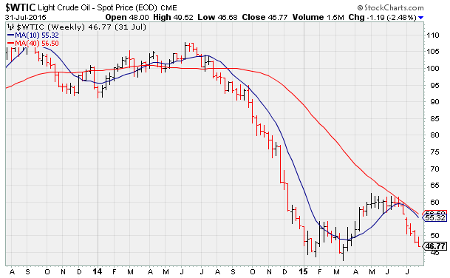
Speaking of Oil, after 7 straight down weeks, it appears that a test of the 2015 lows is near…
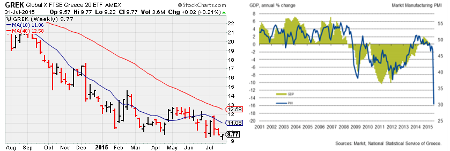
And Greece is not out of the headlines yet as their economy and their equities struggle to recover…
The latest reading of the Greek Purchasing Managers Index for the country’s manufacturing sector makes for ghastly reading. The index tanked to 30.2 in July, its weakest point ever, according to Markit. That drop is from 46.9 in June. Anything under 50 signals contraction…
Phil Smith, an economist at Markit says: “Manufacturing output collapsed in July as the debt crisis came to a head. Factories faced a record drop in new orders and were often unable to acquire the inputs they needed, particularly from abroad, as bank closures and capital restrictions badly hampered normal business activity. Demand was hit amid the heightened uncertainty surrounding Greece’s future, leading both total new business and exports to contract sharply, and it remains to be seen how long it takes these to recover. Although manufacturing represents only a small proportion of Greece’s total productive output, the sheer magnitude of the downturn sends a worrying signal for the health of the economy as a whole.”
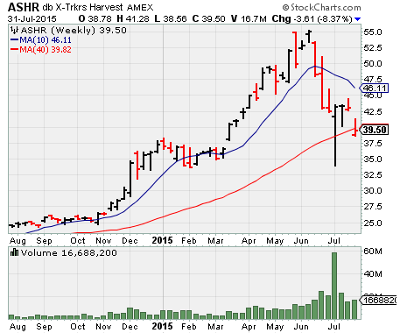
In China, the Global X FTSE Greece 20 (NYSE:GREK) tracking the local A-shares ended the week below its 200 day low…
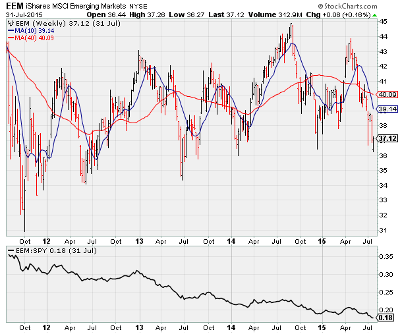
China & Brazil’s pain are having significant effects on the main iShares MSCI Emerging Markets (ARCA:EEM) ETF which refuses to even try to get up off the mat against the S&P 500…
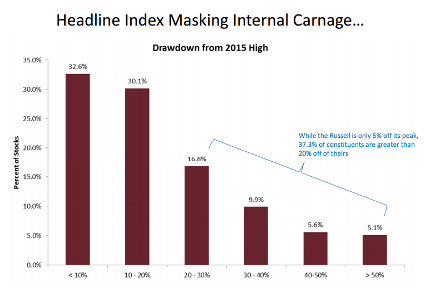
Much has been written on weak breadth at the S&P 500 and NYSE. But RenMac takes a deeper dive into the Russell 2000 (Small Caps) and finds that breadth is equally distressing…
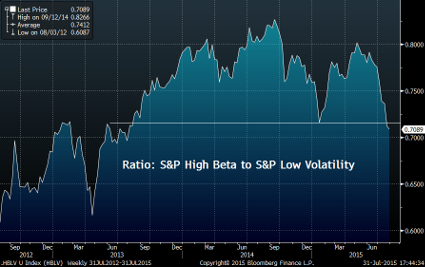
We watch High Beta vs. Low Volatility closely at 361 Capital. Here is a big break in trend…
@MktOutperform: Ratio of High Beta to Low Vol stocks at lowest level since Jul 2013. Defensive behavior underneath the market. $SPHB
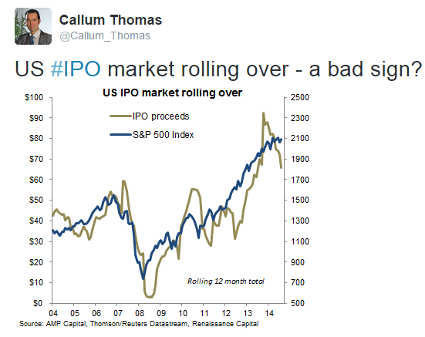
And even IPO proceeds are starting to ebb. Is the low appetite caused by the quality of the deals?
For Oil & Natural Gas investors, the news just gets worse and worse…
The administration’s plan will force the utility industry to shift toward cleaner-burning energy sources for decades to come as the EPA sets the first-ever limits on greenhouse gases from power plants, requiring a 32% cut in emissions by 2030 from 2005 levels. The target is ambitious, requiring deeper cuts than the 30% proposed in a draft rule released last year. It also seeks to prevent a further shift from coal to natural gas in electricity generation. Over the last few years, utilities have been shifting to natural gas, which produces 50% less carbon emissions than coal but still more than zero-emitting sources like wind and nuclear power. That shift has been helped along by the domestic boom in gas production since 2008.
But keep in mind that falling natural gas prices in the U.S. are very good news for future global manufacturing decisions…
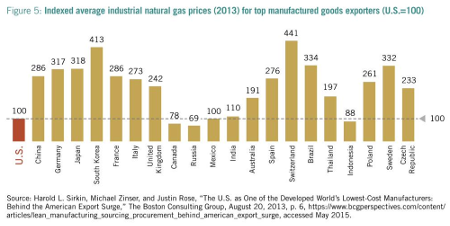
So many are looking for a mean reversion bounce in the Energy space, but what if this is just the beginning of lower demand caused by the accumulation of several shifts in demand…
“Should have seen it coming, but we’re scientists,” he said. “The first study estimated America faced a 70 gigawatt deficit by 2030 to meet new commercial real-estate needs.” Seven years later they estimated a 30 gigawatt surplus – a 100 gigawatt swing. “Landlords are earth’s cheapest people and have long time horizons. They’re introducing energy-saving efficiencies in old buildings faster than they build new ones.” The incandescent bulbs we grew up with are heaters that give off a little light. New LED bulbs are 10x more efficient, last 20x longer, and their price is plummeting. “In 2011, the U.S. set non-subsidized solar price targets to compete head-to-head with coal by 2020. Solar panels were forecast to be 50% of total costs, they’ve already plunged to 15%.” 70% of new U.S. electricity capacity in H1 2015 was renewables, up from 50% in 2014. “The next wave is storage. Once we can store electricity cheaply, homes, apartment buildings, and businesses can drop off the grid, or form micro-grids supplemented by localized natural gas generators.” It’s already started with Tesla Powerwall. “Cheap storage, ubiquitously adopted, renders the national grid obsolete.” U.S. electrical capacity is over 1,100 gigawatts. The world is adding 55 gigawatts of solar annually, and about the same amount of wind; expanding 20% per year. Small but accelerating changes compounded over 40yrs yield quantum transformation. And it’s taking place in medicine, transportation, communication, collaboration, education, 3D printing, robotics, agriculture, artificial intelligence. “Every generation has excitement in one form or another.” There’s so much happening now that it’s hard to properly comprehend. “But some of these markets that need to change are so large that their transformation will be like watching leaves turn. They’re green, and without being able to quite place when it happens they’ll have changed to yellow, orange, then brilliant red.”
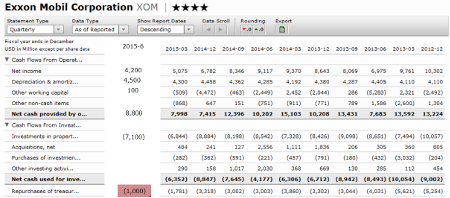
Exxon (NYSE:XOM) reported last week. Once a serial acquirer of shares, they have had to cut their pace 80% from 3 years ago as profits have been cut in half…
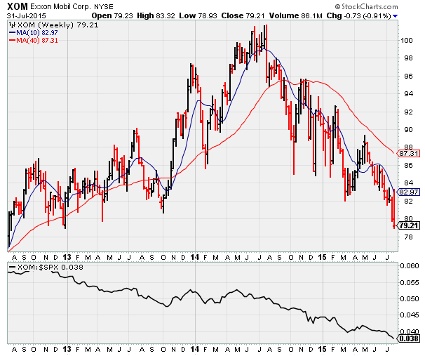
And what was once one of the most beautiful charts in the market is now broken…
Meanwhile the credit investing guru’s at Oaktree Capital are doing their homework on the Energy space, but have yet to back up the truck…
“The psychology is starting to turn negative, but it’s just beginning and we haven’t dived in yet by any means. We have a lot of dry powder and we are right now accessing opportunities that again are structured to basically minimize the risk. But we also want to take advantage if now happens to be in retrospect the right time to step in for part of the opportunity. So our instinct is that it’s not time to dive into the water completely, but it is time to take advantage of low oil prices and gas prices.”
Bloomberg reporters covering Commodity hedge funds had a busy July and put their vacations on hold for August…
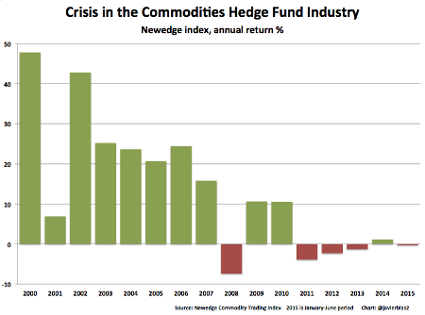
Most surprising are the Hedge Funds’ inability to generate huge returns as Commodity prices collapse…
@JavierBlas2: The #commodities hedge fund industry in crisis: multiple closures, AUM collapsing and average Jan-Jun returns down
Maybe Commodity Hedge Funds should convert into Japanese Equity Hedge Funds because all the stars are lining up for significant positive structural changes…
Mitsubishi UFJ Financial Group Inc., Japan’s largest bank by assets, said Friday it may sell billions of dollars of shares it holds in other companies, the latest example of decades-old ties being dissolved. A Japanese corporate-governance code that took effect June 1 requires listed companies to provide a rationale for their cross-shareholdings, stakes that allied companies own in one another. The rule is meant to press them to put their capital to better use. Mitsubishi UFJ (NYSE:MTU) said it studied most of its major cross-shareholdings and found that about 20% fail to deliver the minimum return it expects on assets. “We’ll urge underperforming companies to improve returns but will consider selling the shares if the standard is not met in a given time,” the bank said in a report, without specifying the standard. Overall, the bank has about ¥5.5 trillion ($44 billion) in cross-shareholdings.
…And even their core manufacturing sector is significantly outperforming, as exporters take advantage of the weak Yen…
One of the auto industry’s little guys is quietly emerging as one of its biggest when it comes to profit margins. Fuji Heavy Industries Ltd. (TOKYO:7270)., the maker of Subaru all-wheel-drive wagons, on Friday posted a 17.5% operating margin for its latest quarter, far exceeding larger Japanese auto makers and widely outpacing German luxury brands. The company, which also makes airplane components, said net profit rose 61% from a year earlier as its strategy to stay relatively small and limit most of its production to its home market paid off. “We want to be an auto maker that dominates with profit margins and quality rather than quantity,” Chief Financial Officer Mitsuru Takahashi said at an earnings briefing.
Do the London Bookmakers have a line yet for what date Google (NASDAQ:GOOGL) or Facebook (NASDAQ:FB) will unleash the Kraken?
I love this piece. Focus on putting up performance, not managing to a benchmark…
Remember that benchmark is a noun, not a verb — namely, “A standard or point of reference against which things may be compared or assessed,” according to Oxford Dictionaries. Where in this definition does it say that you should navigate to the benchmark? Your job is to navigate away from, and better than, the benchmark.
The information presented here is for informational purposes only, and this document is not to be construed as an offer to sell, or the solicitation of an offer to buy, securities. Some investments are not suitable for all investors, and there can be no assurance that any investment strategy will be successful. The hyperlinks included in this message provide direct access to other Internet resources, including Web sites. While we believe this information to be from reliable sources, 361 Capital is not responsible for the accuracy or content of information contained in these sites. Although we make every effort to ensure these links are accurate, up to date and relevant, we cannot take responsibility for pages maintained by external providers. The views expressed by these external providers on their own Web pages or on external sites they link to are not necessarily those of 361 Capital.

