Stocks were weaker on June 3, with the S&P 500 falling by 35 bps, while the Qs dropped by more than 1%. Today is likely to be a deciding day, with the big May job report. With that meaning which way the next major move will be.
Trying to handicap the job report lately is nearly an impossible task, and I’m going to try and do it. The ADP job report was much stronger than expected, and let’s put it this way. Historically, the ADP and BLS job reports don’t stay out of sync for too long. That means there is a good chance that the nonfarm payroll comes in above consensus estimates of 650k and maybe even hotter than the highest estimates for 1 million jobs.
A hot job report will only make matters worse for the equity market, as it will likely move the Fed one step closer to a potential taper. The Fed may have already started the process when it announced it would begin to unwind the corporate credit facility. I think this is a step in the direction of the start the tapering process. But we should remember that a Fed taper will take a very long-time, but the market will anticipate this, and that will send rates on the long-end of the rate curve higher over time.
10-Year Rates
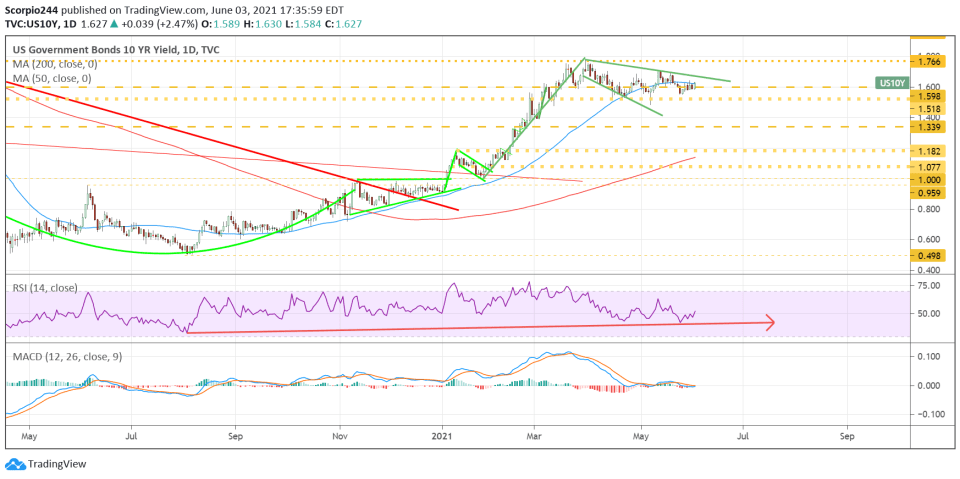
The 10-Year rate has stalled, but I view this as a consolidation before the next move higher. Today’s job report could easily provide the spark that sends rates up.
It isn’t just higher rates that continue to threaten the S&P 500; as mentioned in this week’s tactical update, decelerating growth may also weigh on the S&P 500, and that means that it should lead to PE contraction.
Additionally, as I go through in the report, despite the difference in the economic cycle, the decelerating growth rate is not dissimilar from the earnings cycle of 2001. The path of yesterday’s multiple expansion and the S&P 500 matches up too perfectly with that of 1998 through 2002. If this trend continues, then this is the peak in the cycle from a multiple expansion standpoint, with lower multiples to come.
Amazon
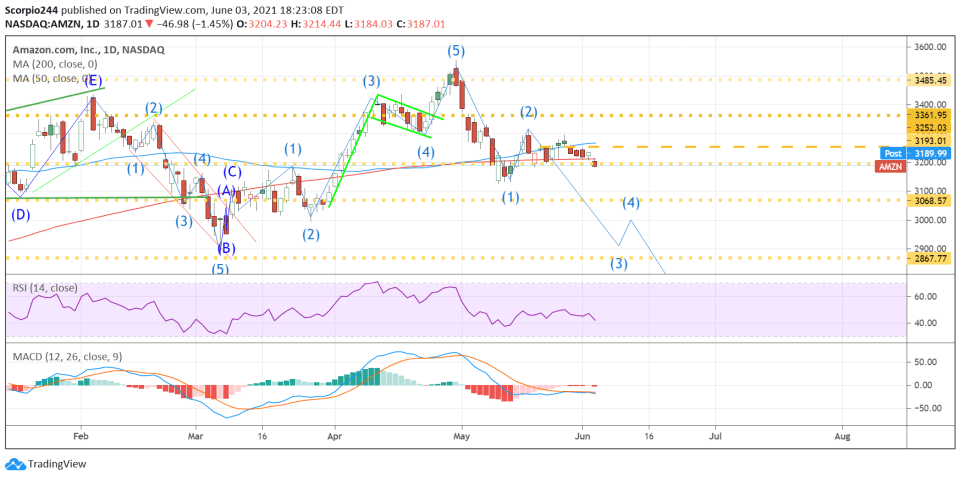
Amazon (NASDAQ:AMZN) continues to struggle and is now sitting on support at $3,190. The stock also closed below its 200-day moving average yesterday, again. This is a big level of support for the stock. A break of support likely confirms that we are starting an impulsive wave 3 down, which could take the stock as low as 2,870.
Apple
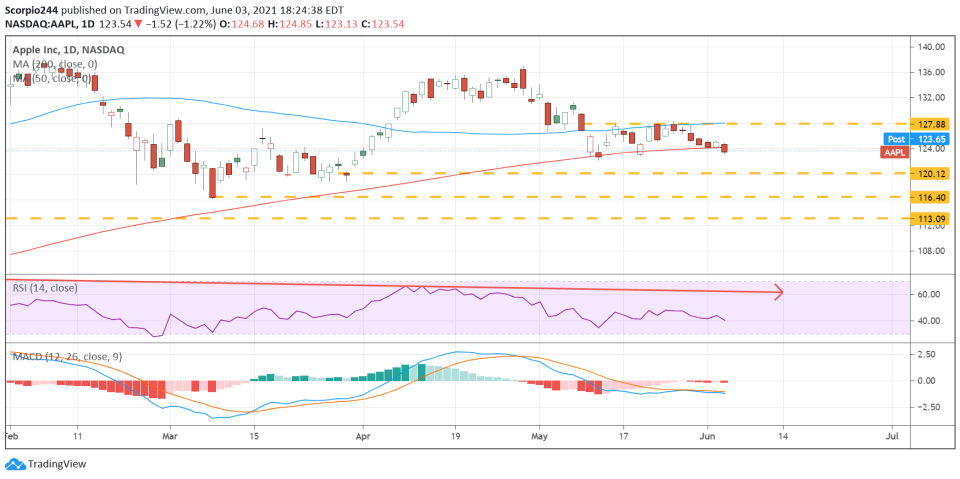
Apple (NASDAQ:AAPL) also closed below the 200-day moving average. The next support level is $120.
Qualcomm
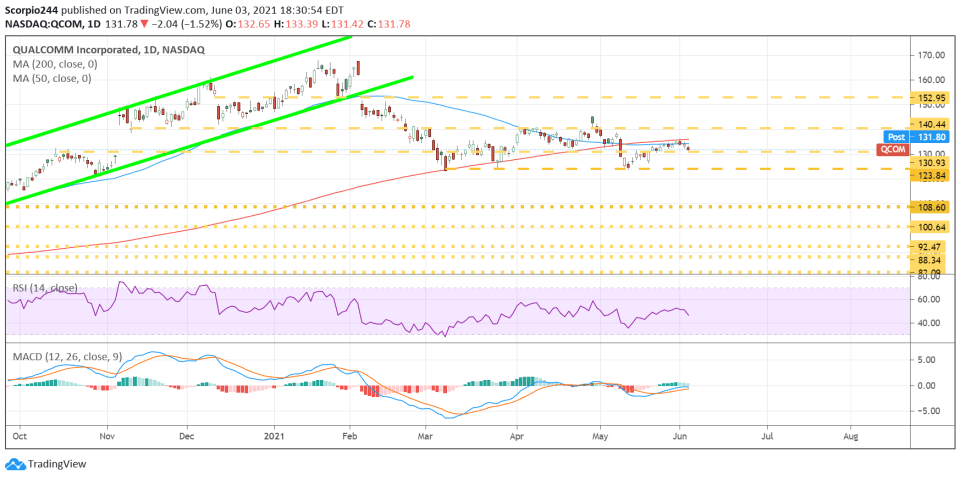
Qualcomm (NASDAQ:QCOM) failed to push above its 200-day moving average on Wednesday and went lower yesterday. That is clearly acting as a resistance level, and it could result in it heading back to $123.


